
You've shipped the features, but do your users actually like using them? Product analytics can tell you what's being used, but not whether people find those features valuable, intuitive, or frustrating. A product feature satisfaction survey gives you a structured way to measure how users experience your product, so you can identify what's working, what's causing friction, and where to focus your next improvements.
The problem with measuring product satisfaction
Most product teams have solid data on feature adoption and usage frequency. But usage doesn't equal satisfaction – a feature can be heavily used and still frustrate users. Someone might rely on your search function every day and still find it slow, inaccurate, or confusing.
Without a structured way to capture how users feel about specific features, teams are left guessing which improvements will make the biggest impact. Internal assumptions about what's working well don't always match what users actually experience, and when negative sentiment goes unnoticed, it can quietly drive churn before anyone realizes there's a problem.
This template gives you a ready-made survey to collect product feature satisfaction data directly from users, so you can spot issues early and focus your improvements where they matter most.

What this template helps you discover
This product feature satisfaction survey helps you uncover specific, actionable insights about how users experience your product:
Which features users find most valuable and why they rely on them
Which features cause frustration, confusion, or difficulty
How satisfied users are with the core functionality they use most often
Where usability improvements would have the greatest impact on the overall experience
How users feel about your product's feature set as a whole
What you'll test
This template covers three key dimensions of product feature satisfaction, giving you a well-rounded picture of how users experience your product.
Feature satisfaction
Feature satisfaction measures how happy users are with the specific functionality your product provides. You'll learn which features create the most value for users and which ones fall short of expectations. This helps you understand not just whether features are being used, but whether they're meeting the needs they were designed for.
Usability challenges
Usability challenges reveal where users experience friction or difficulty when interacting with your product's features. You'll identify pain points that may not show up in analytics: confusing workflows, unclear labeling, or steps that take longer than expected. These insights help you prioritize design and development improvements that reduce frustration.
Product sentiment
Product sentiment captures users' overall perception of your product's functionality and their likelihood to continue using or recommending specific features. This broader view helps you understand the emotional relationship users have with your product, beyond satisfaction with individual features.
When to use this template
A product feature satisfaction survey is useful at several points in the product life cycle:
After launching new features: Collect early feedback to understand whether a new feature meets user expectations and where it might need refinement.
During product health checks: Run satisfaction surveys on a regular cadence to monitor how users feel about your core features over time.
When prioritizing your product roadmap: Use satisfaction data to identify which features need the most attention and where improvements will have the biggest impact.
When investigating churn or engagement drops: If usage metrics are declining, a satisfaction survey can help you understand why users are disengaging.
Before major redesigns: Benchmark current satisfaction levels so you can measure the impact of changes after they ship.
How to use this template
Start with a free Lyssna account. Sign up and start exploring with a free plan. Once you're logged in, open this template to get started.
Customize the survey to match your product. Tailor the questions to focus on the specific features you want to evaluate. Add, remove, or adjust questions to reflect your product's functionality and the areas you're most curious about.
Choose your participants. Share the survey with your existing users, or recruit from Lyssna's research panel of 690,000+ participants across 124 countries to reach your target audience.
Launch and collect responses. Set your survey live and start gathering feedback. Most studies using the Lyssna panel return results within hours.
Review your results and take action. Analyze satisfaction scores, identify patterns in qualitative feedback, and use the insights to prioritize your next product improvements.
Example outcomes
Measuring product feature satisfaction helps product teams move from guessing to knowing. Here's what you can expect from running this survey:
A clearer picture of feature performance. You'll see which features users value most and which ones aren't meeting expectations, giving you a data-backed view of your product's strengths and weaknesses.
Prioritized improvements. Satisfaction data helps you focus development resources on the changes that will have the greatest impact on the user experience.
Increased user satisfaction. By acting on direct user feedback, you can make targeted improvements that address real pain points rather than assumed ones.
Reduced product friction. Identifying and resolving usability challenges leads to smoother interactions and a more intuitive product experience.
Stronger alignment with user needs. Regular satisfaction measurement keeps your product roadmap grounded in what users actually want, not just what stakeholders assume.
Who this template is for
This product feature satisfaction template is designed for anyone who needs to understand how users experience specific product features:
Product managers who want to validate roadmap priorities with real satisfaction data and build a stronger case for investment decisions.
UX researchers studying feature usability and looking for structured feedback to complement behavioral data.
Designers optimizing product interactions and seeking direct user input on what's working and what's causing friction.
Customer success teams who want to proactively identify feature-related frustrations before they lead to churn.
SaaS founders looking to validate product-market fit and understand which features drive the most value for users.
FAQs about product feature satisfaction
You may also like these templates
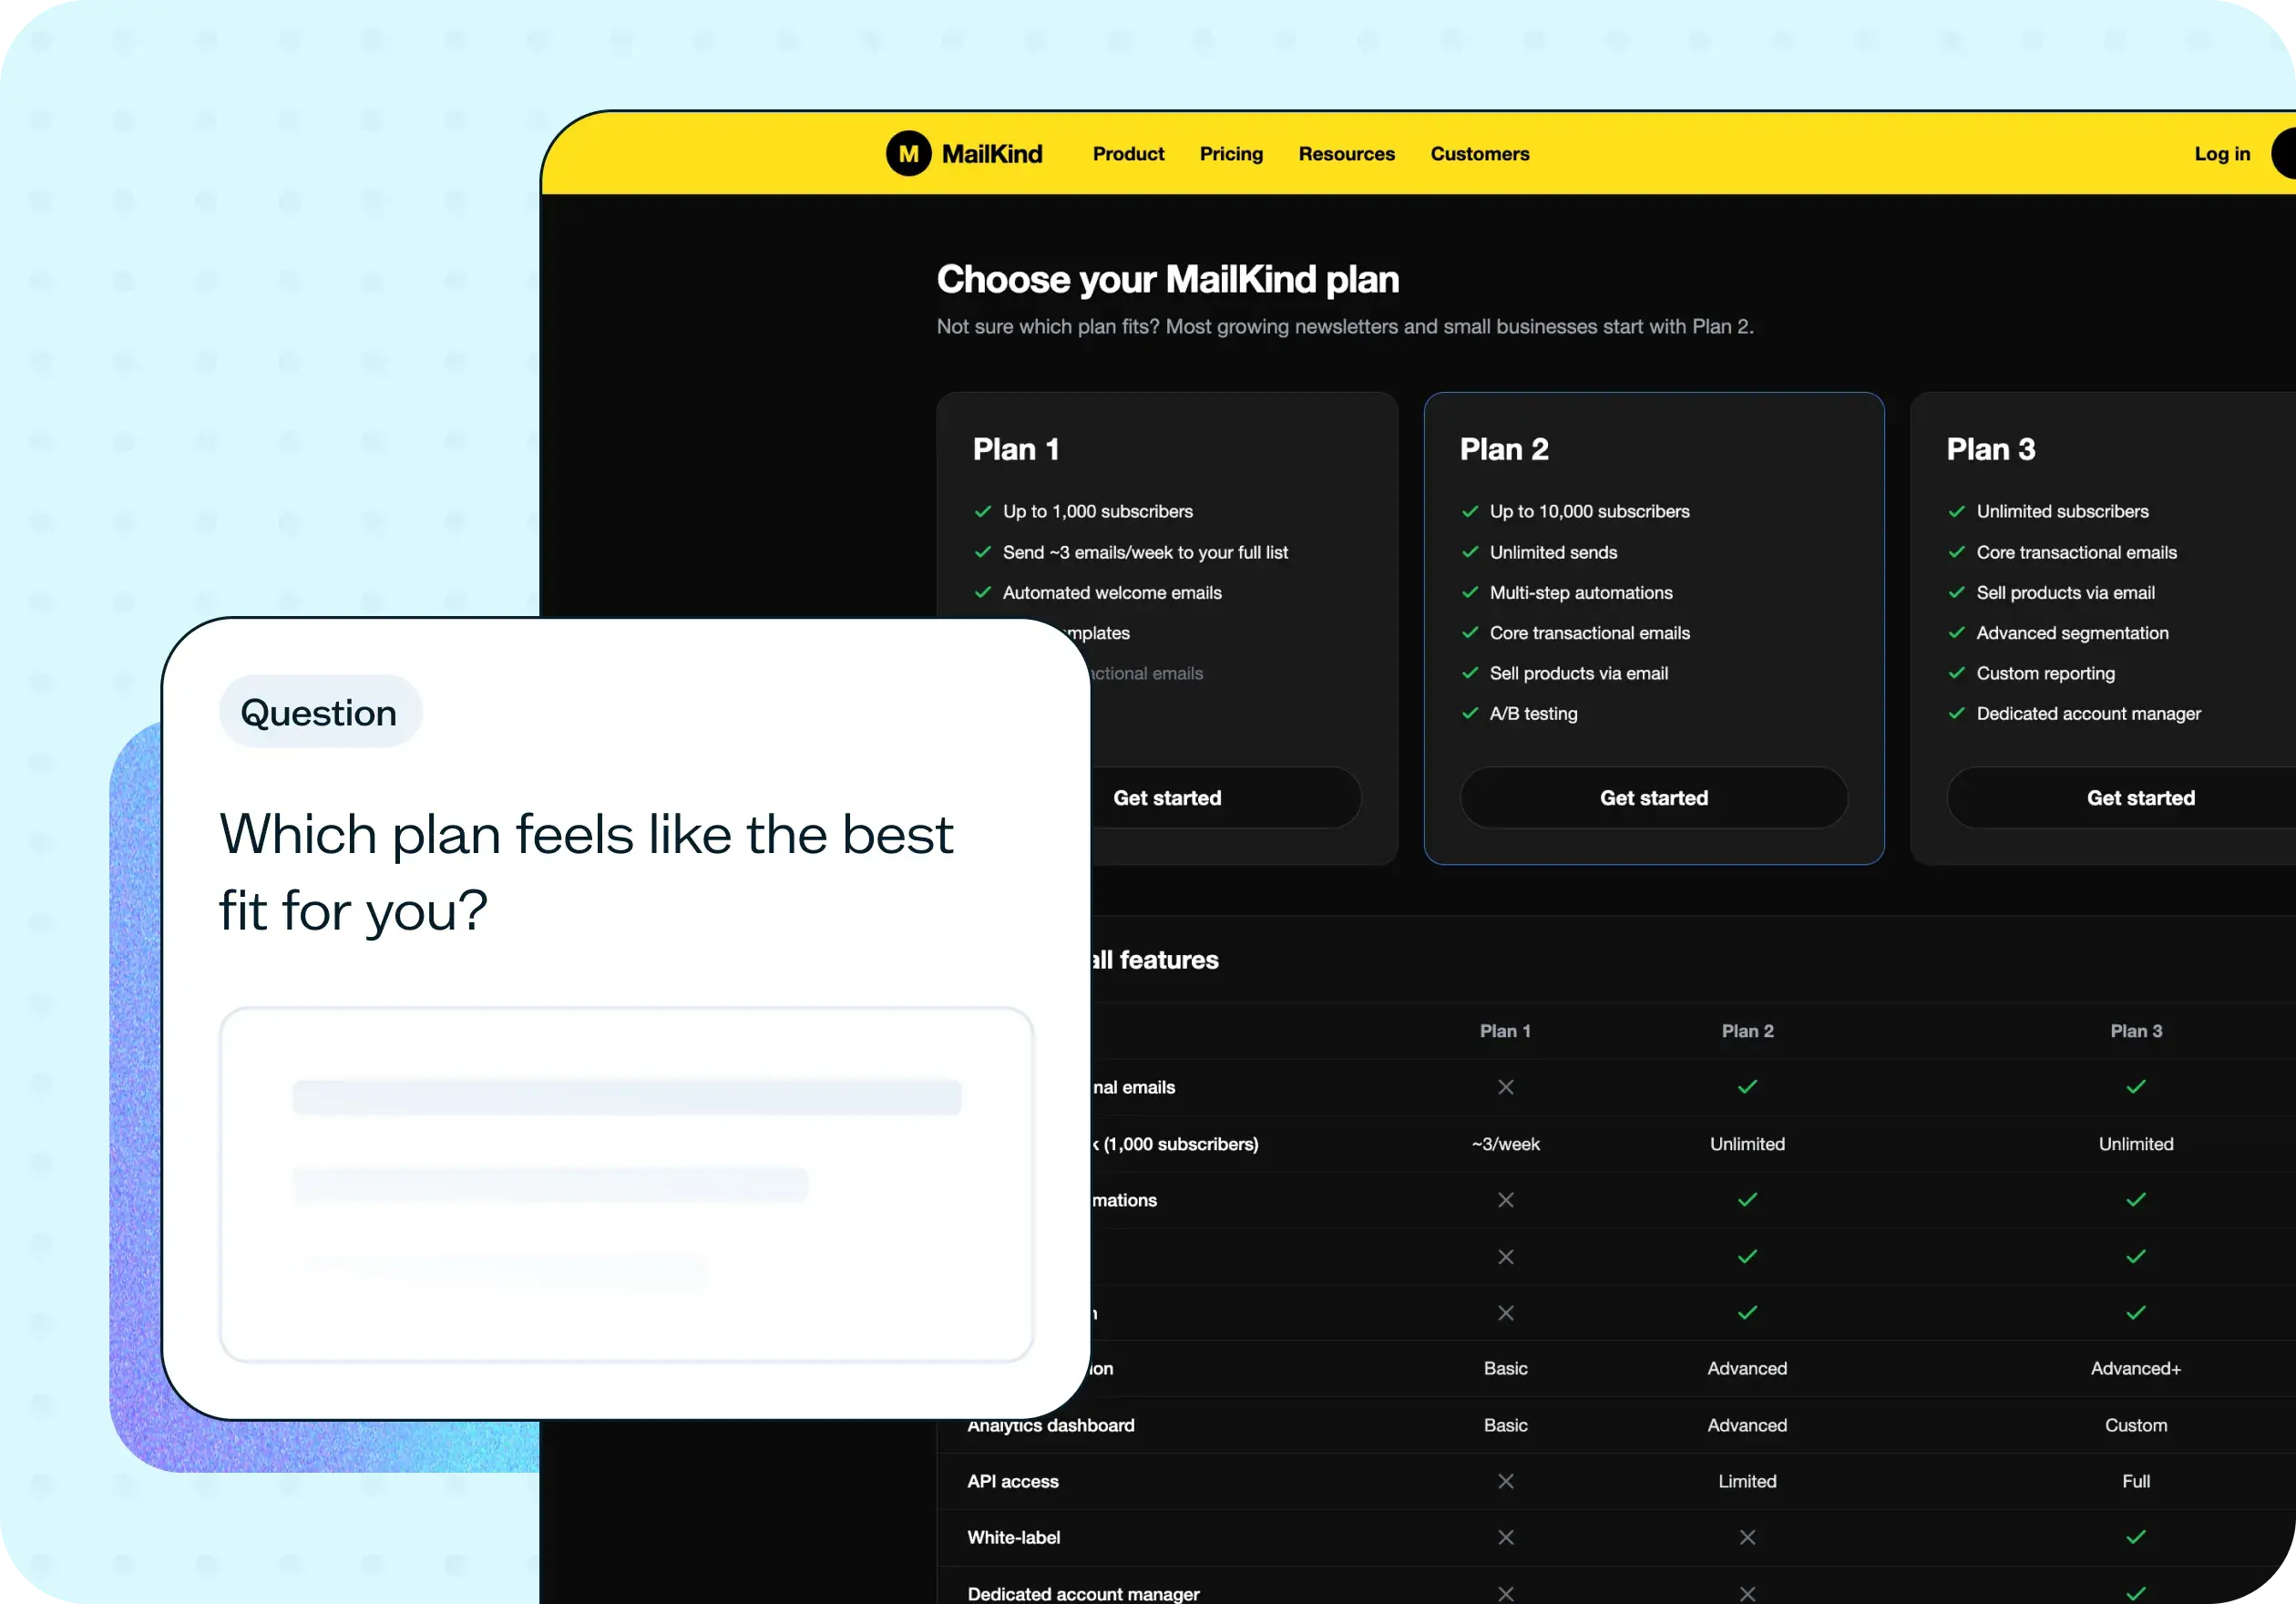
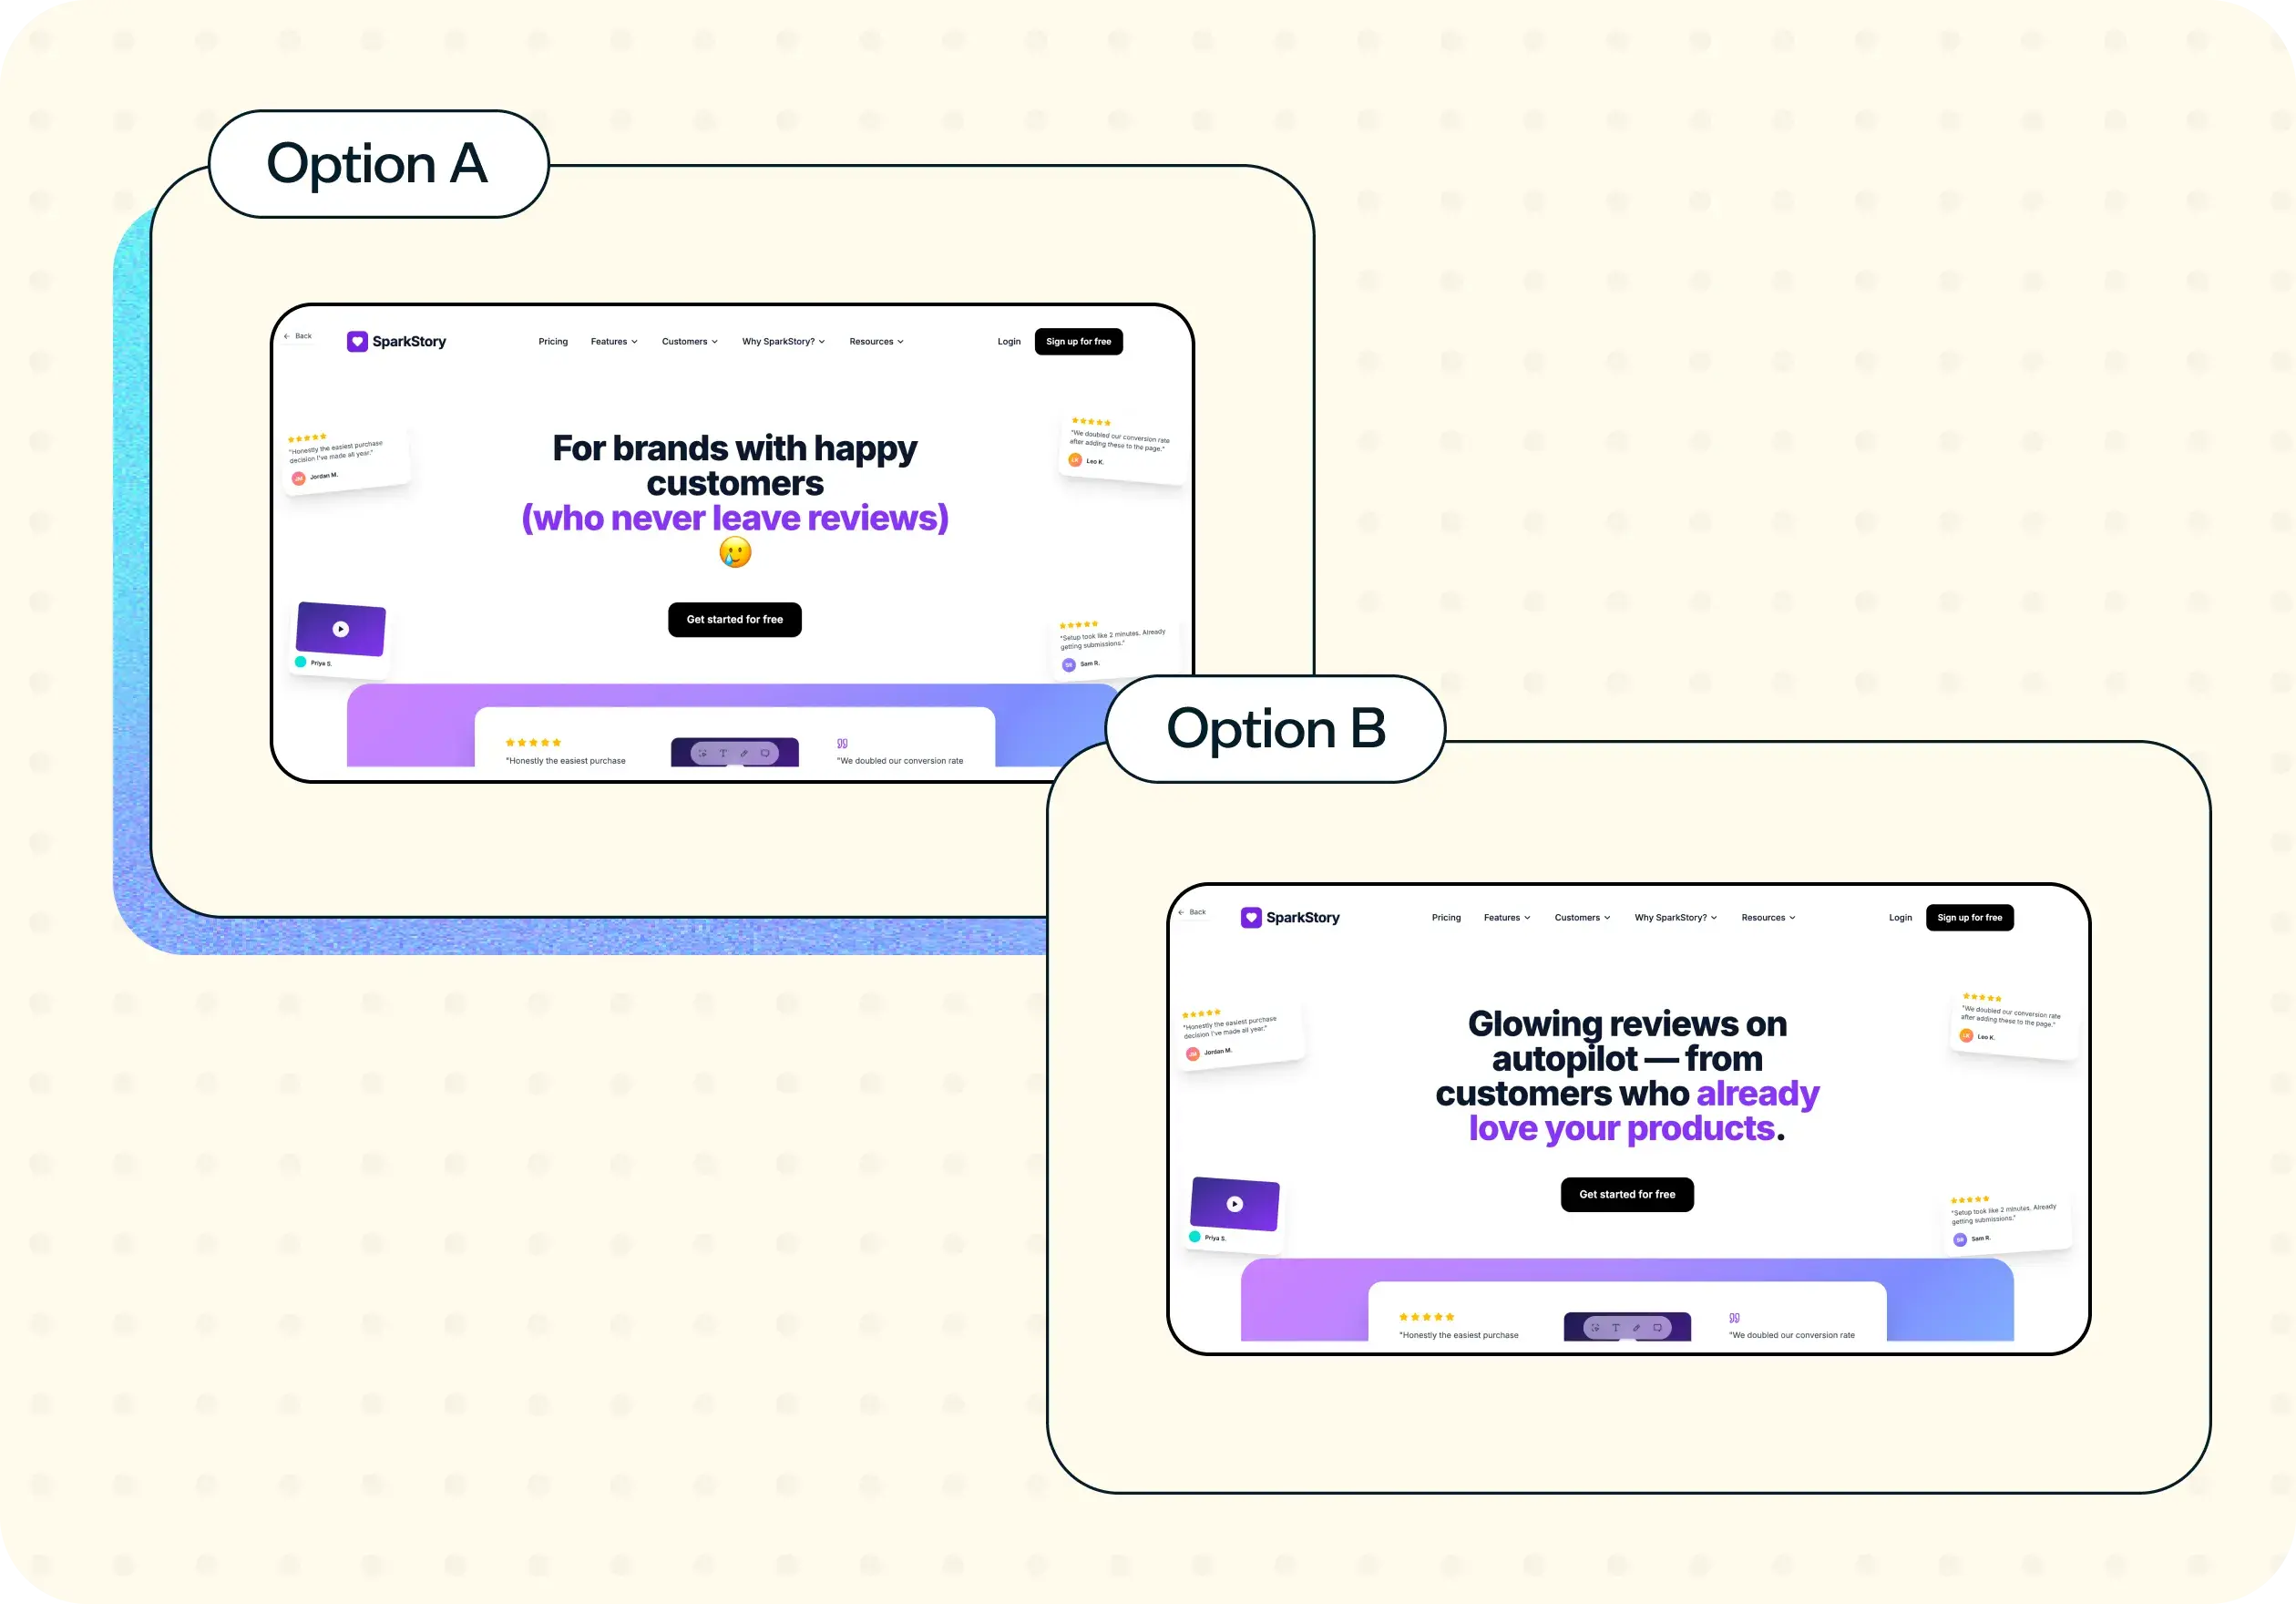
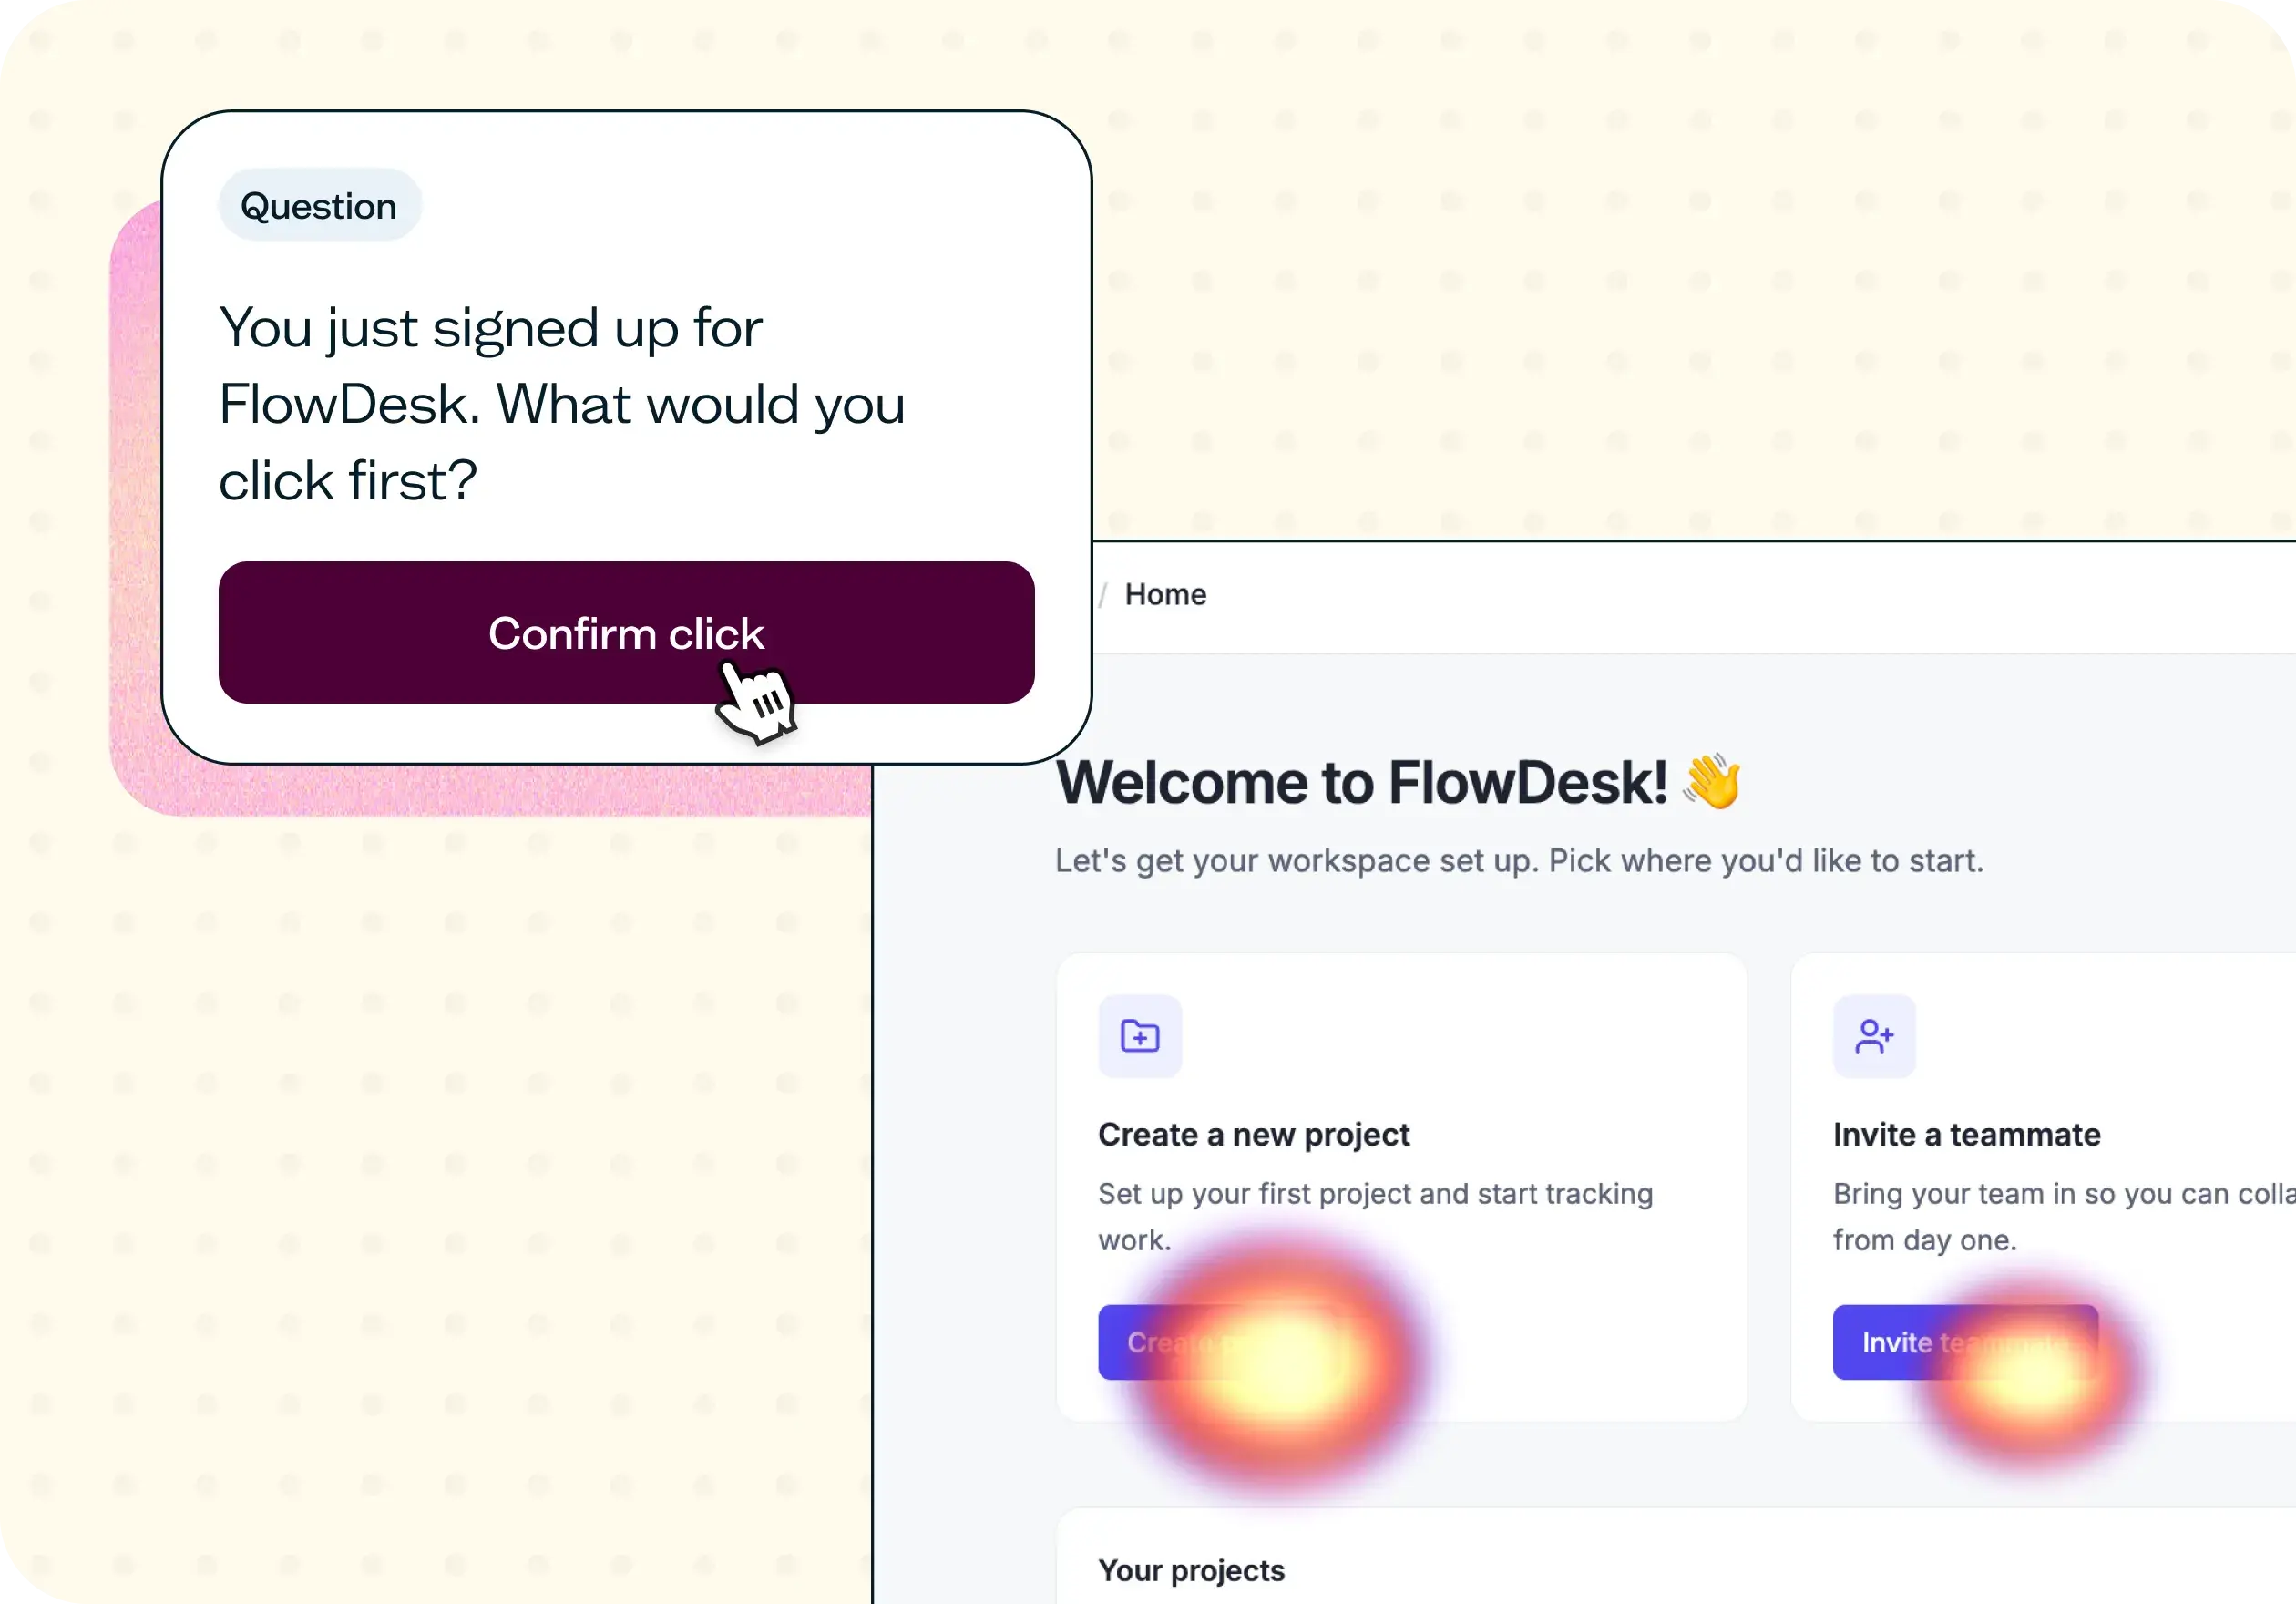

The navigation test is god's gift to UI designers. It probably has the best power-to-simplicity ratio of any software, ever.

Nick Franklin
CEO at ChartMogul