Trusted by 320,000+ designers, marketers, researchers, and product leaders to validate their decisions






















See our card sorting software in action
Improve your information architecture with card sorting
Struggling to design an intuitive and user-friendly website or app? Are your users having trouble finding the information they need? Card sorting can help.
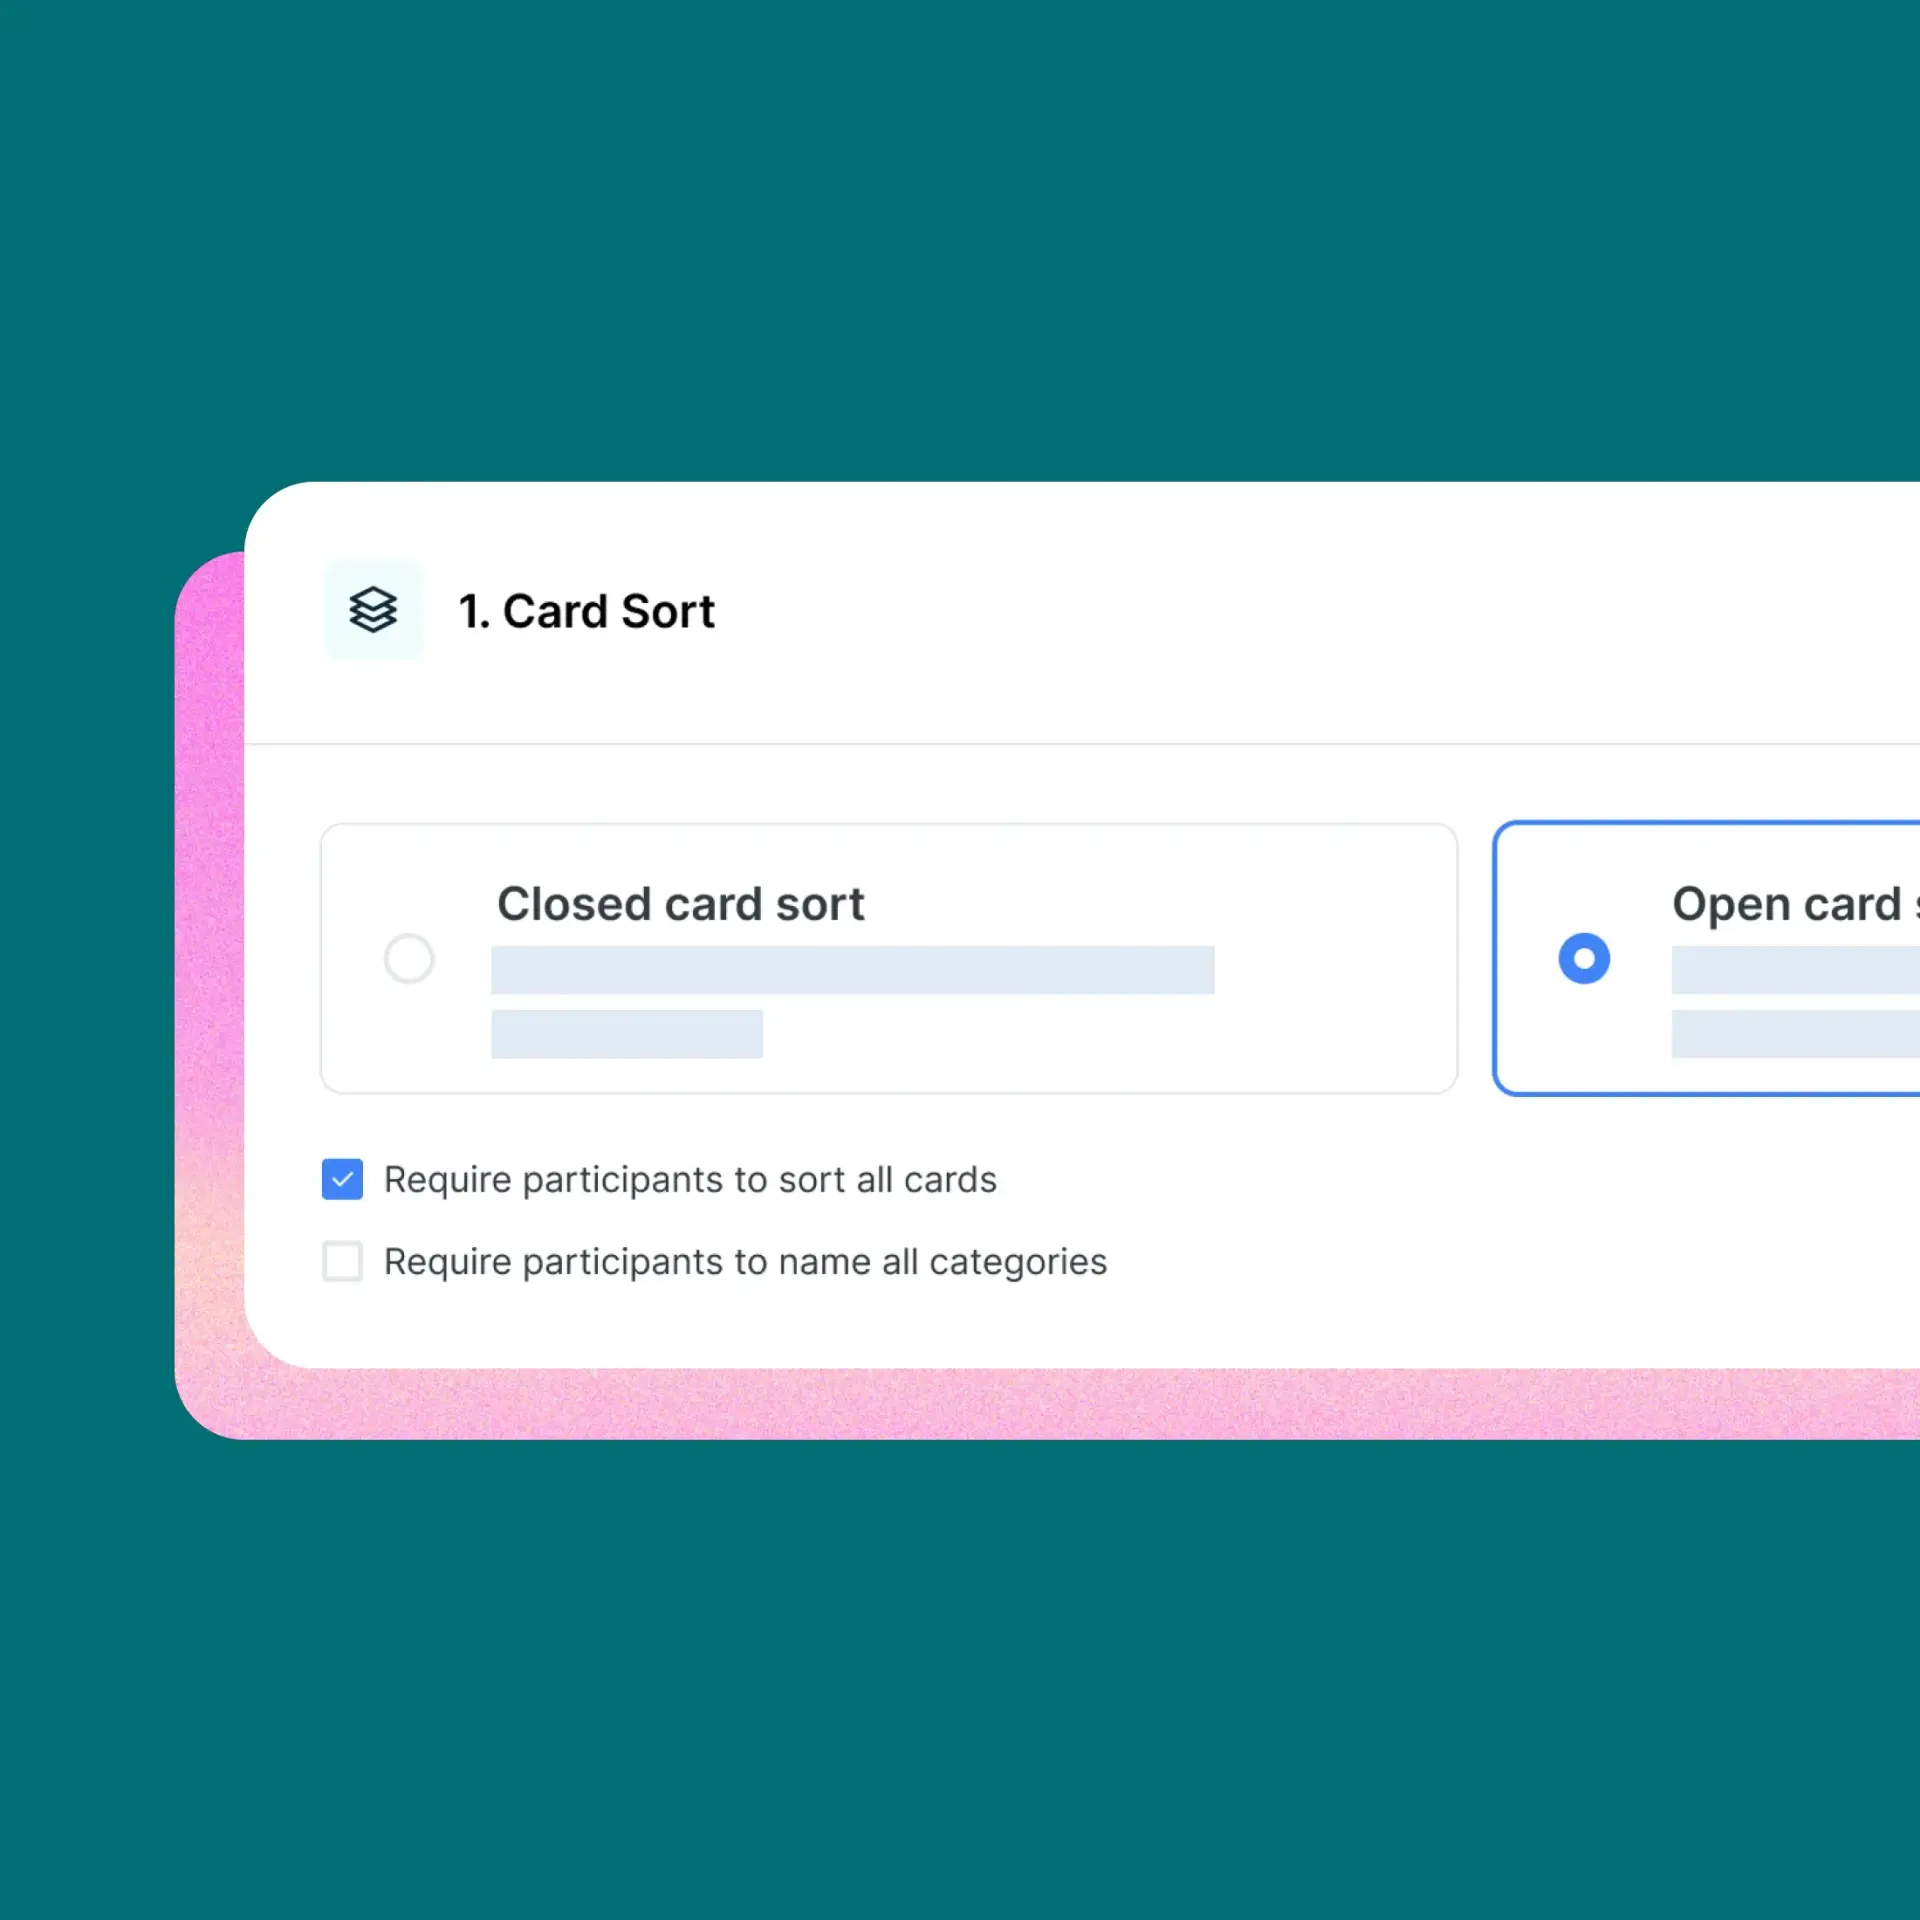
Understand how users group information
Base your design decisions on data, not guesswork. Discover how your audience categorizes and labels your content.

Closed card sorting
Open card sorting
Hybrid card sorting
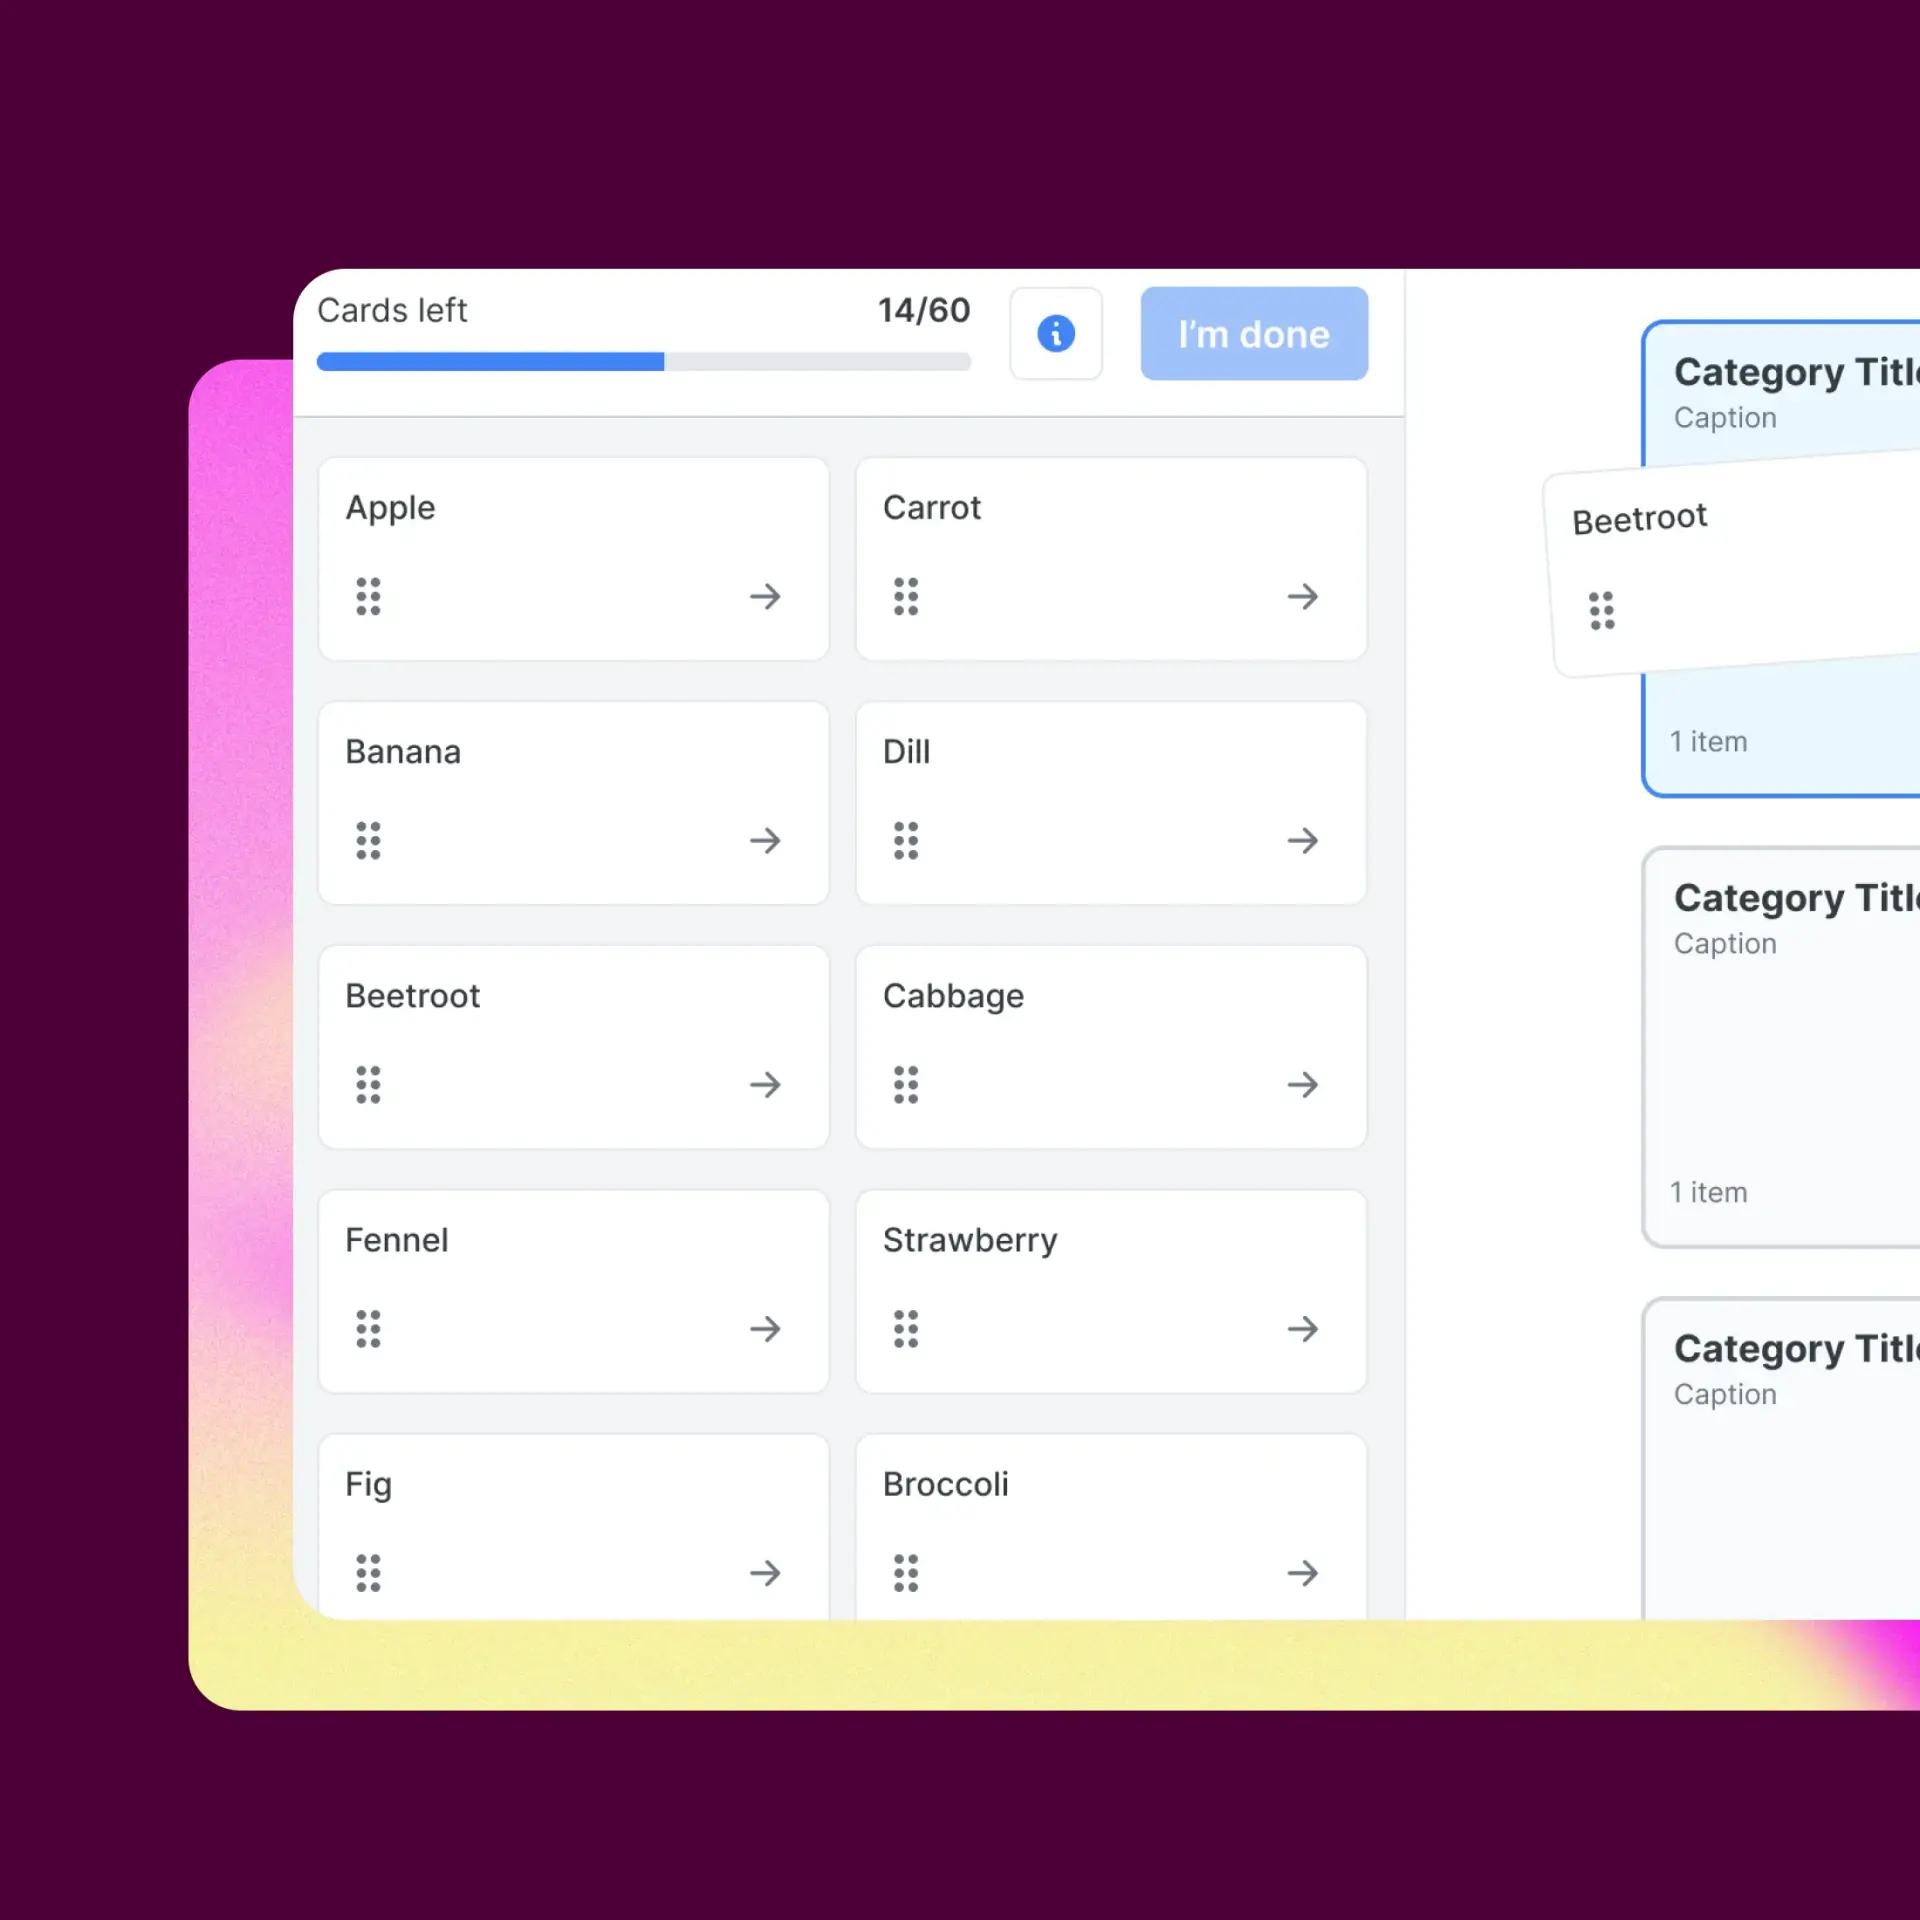
Deliver an experience everyone will love
Build your test in minutes by dragging and dropping images or copy and pasting from a list
Personalize welcome and instructions
Smooth mobile drag and drop UI
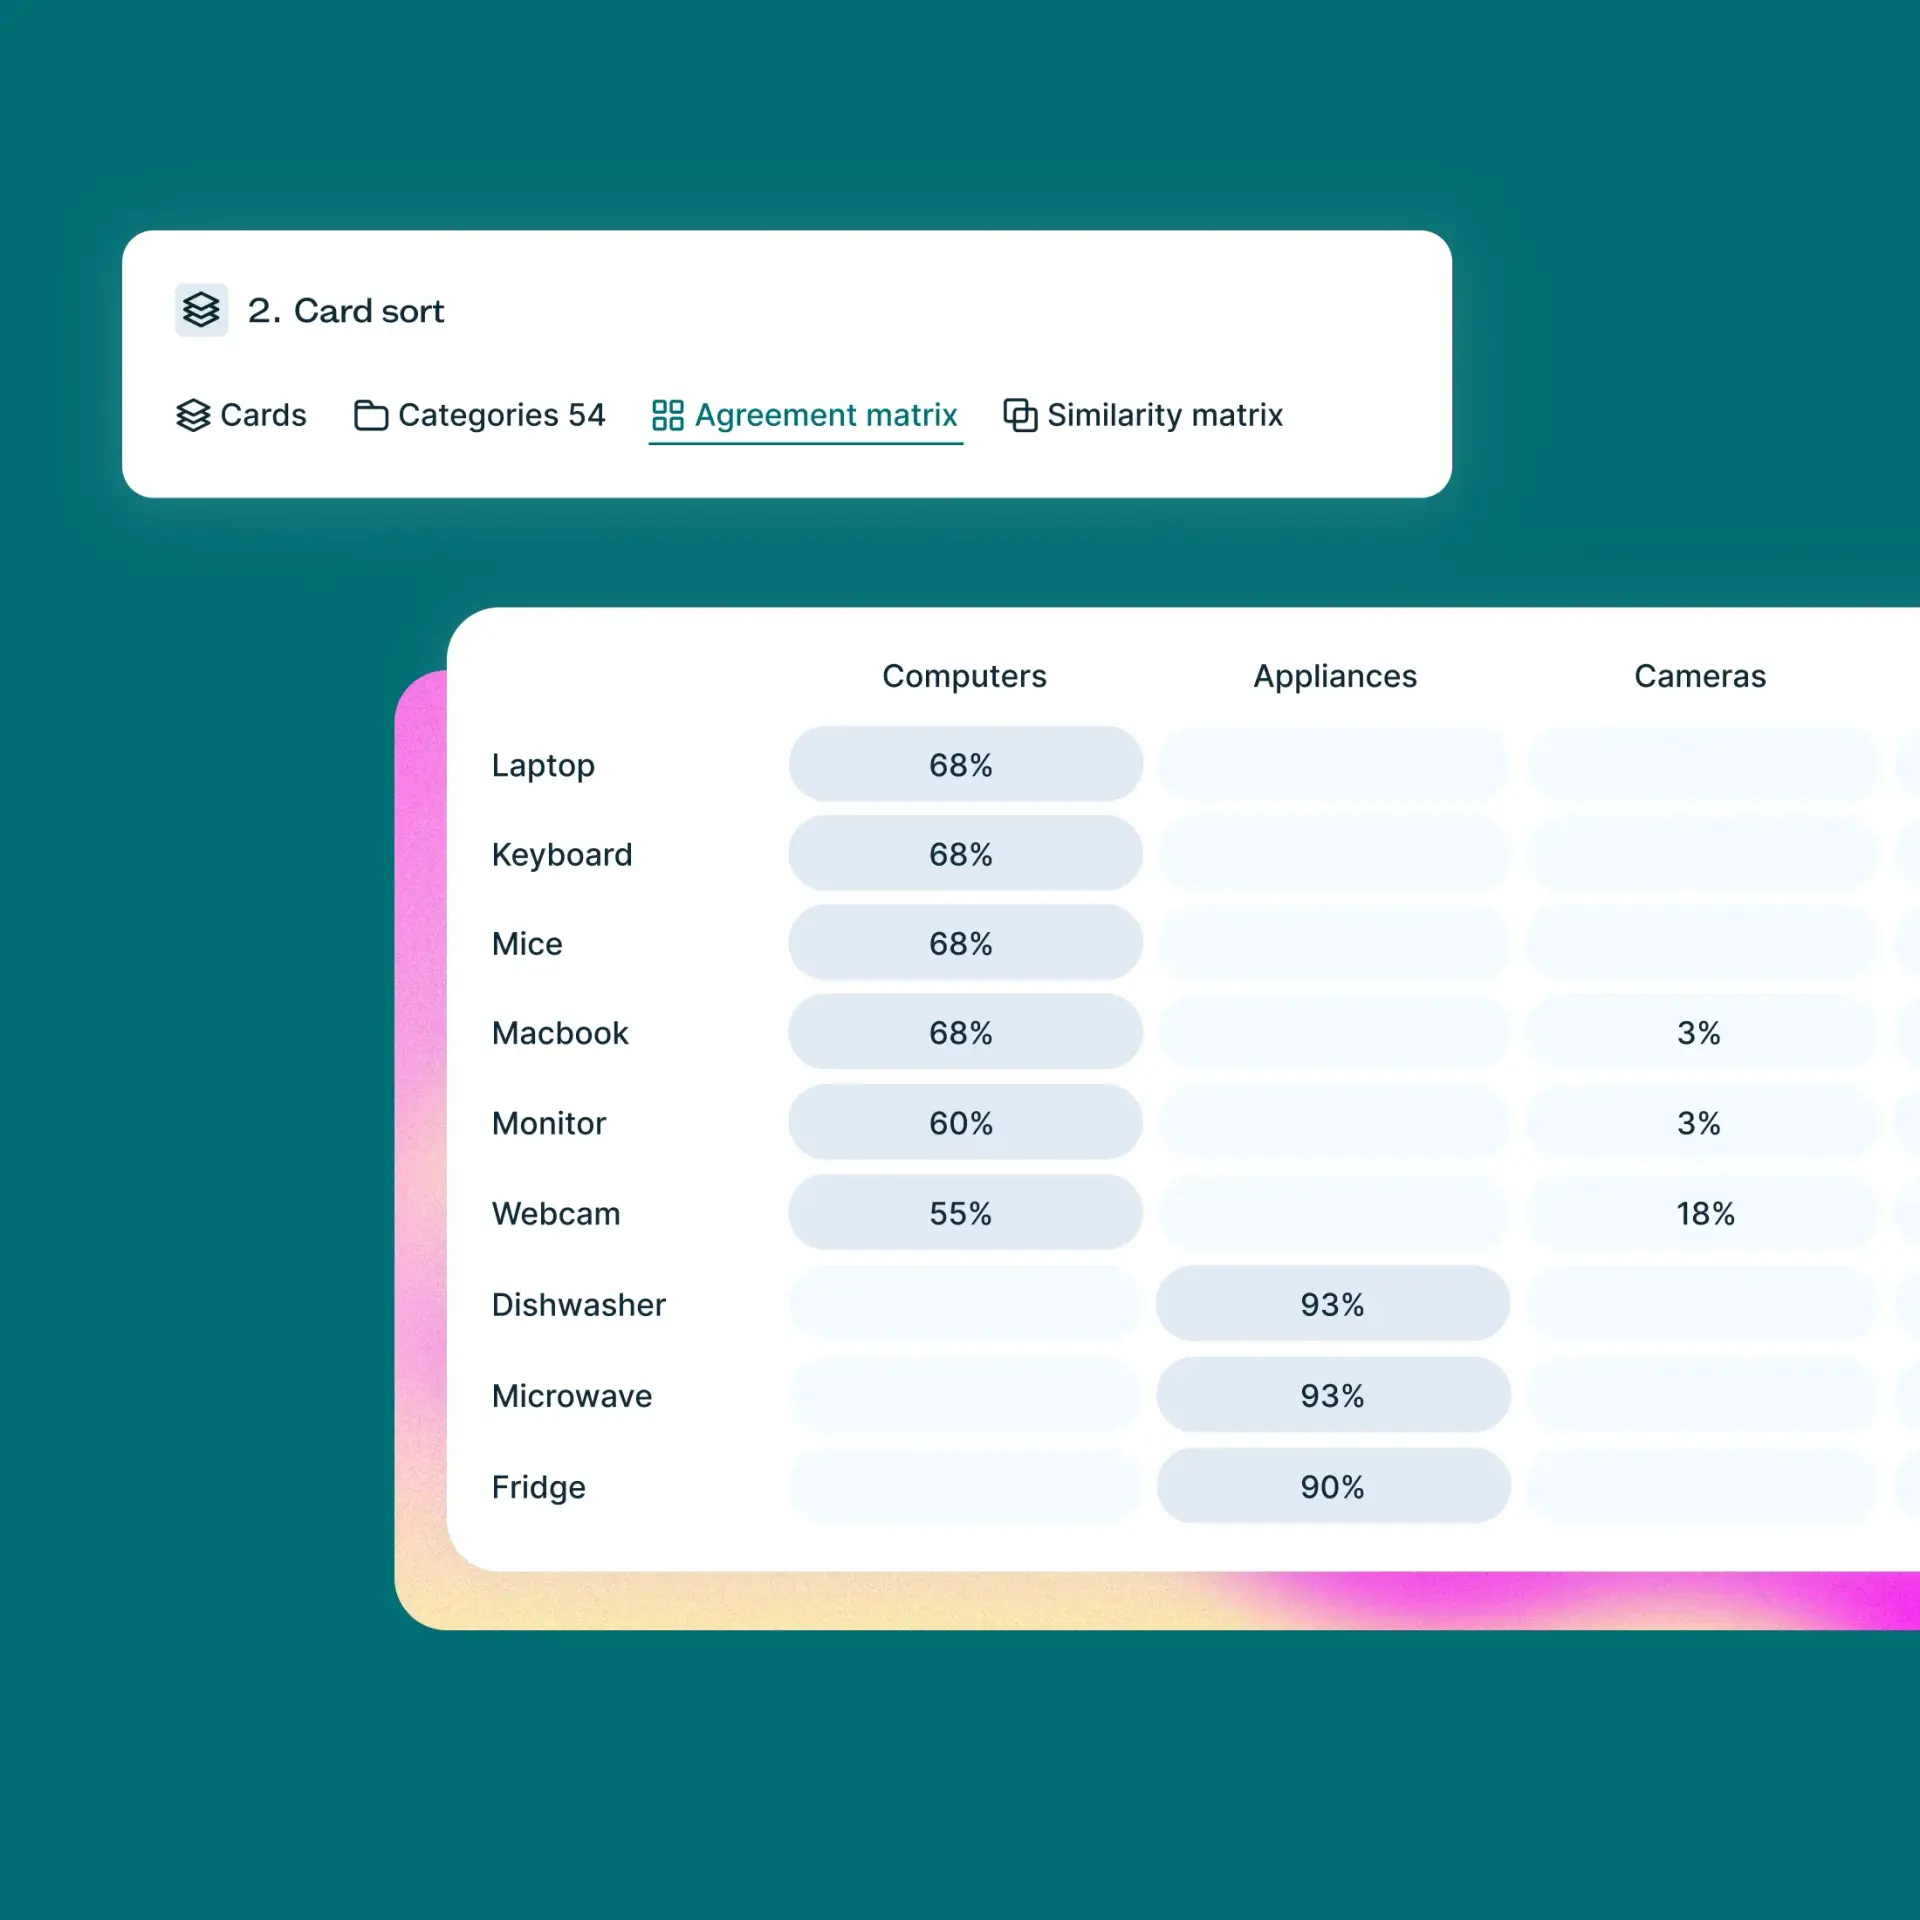
Analyze to find insights you can act on
Analzye results quickly with real-time data visualization. Filter test results to uncover themes and insights.
Agreement matrix
Card and category view
Similarity matrix
See card sorting in action
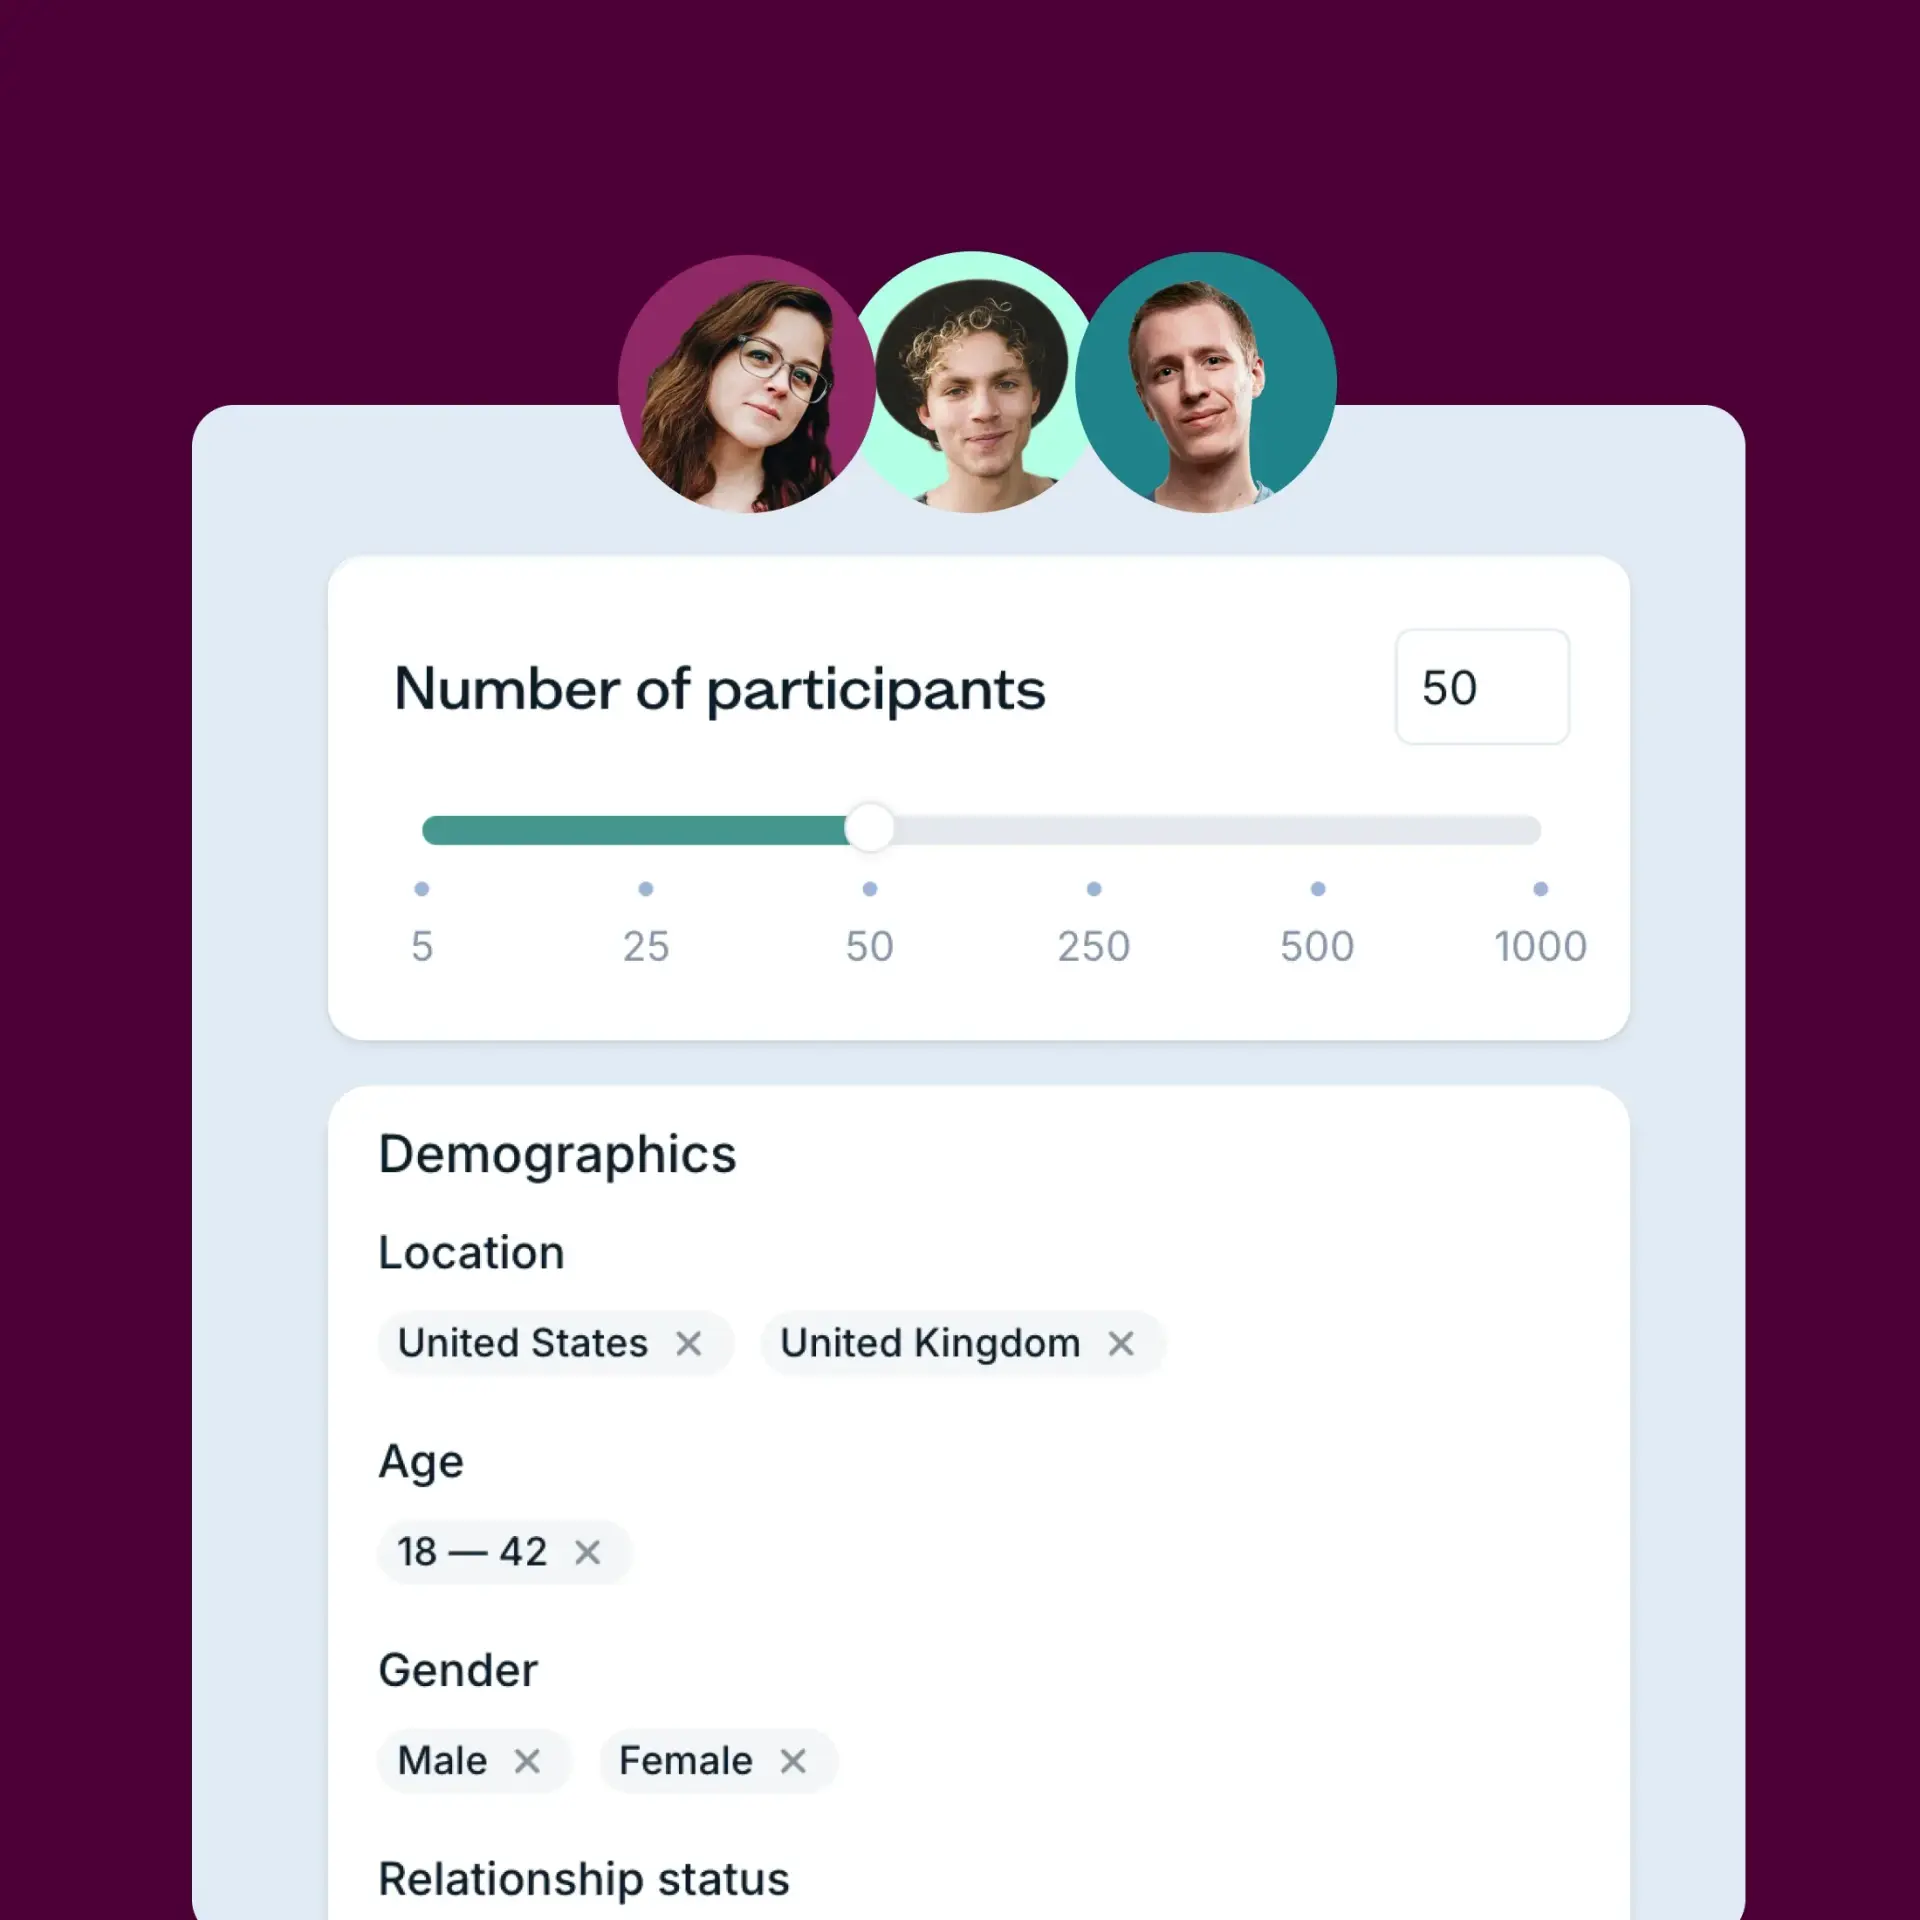
No participants? No problem
Our integrated panel allows you to quickly and affordably recruit both B2C and B2B research participants that precisely match your target audience.
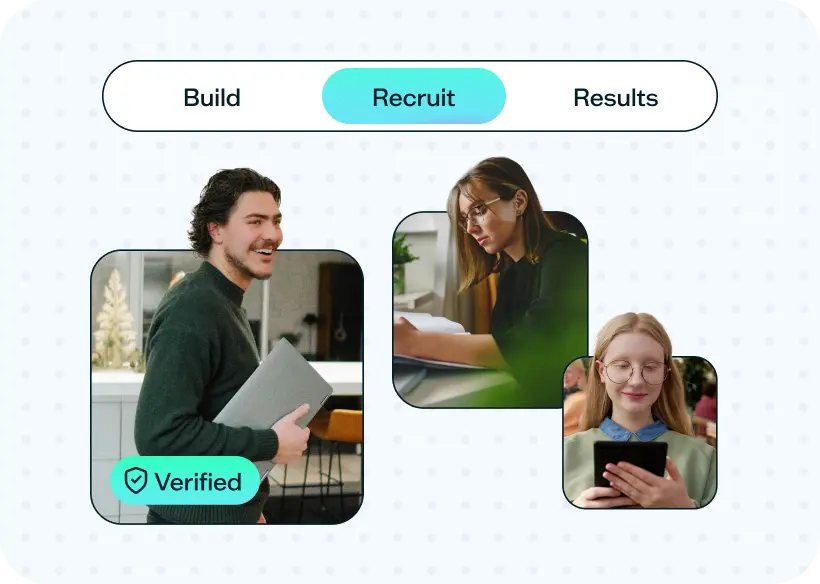
Quality guaranteed
Run research with confidence. If participants don’t meet expectations, we’ll make it right.

Precision targeting
Combine demographic filters and screeners to find the best-fit participants.
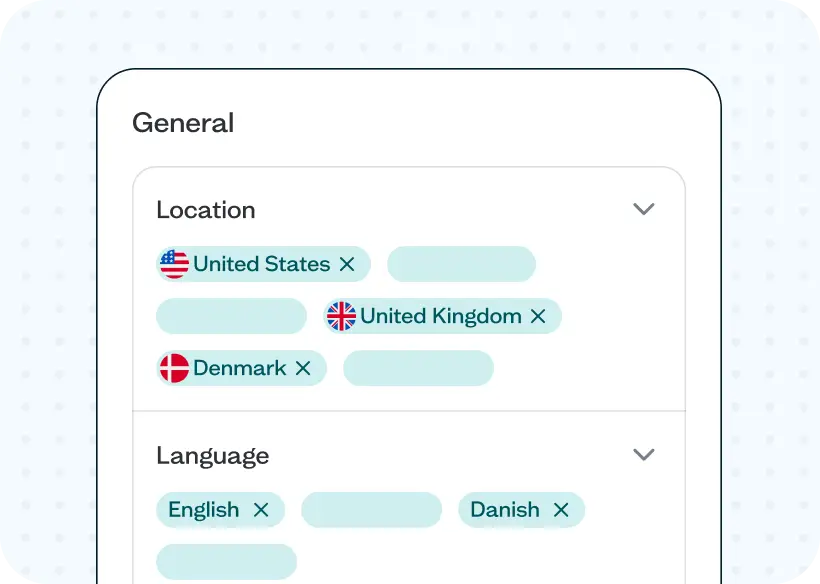
Global reach
Recruit from 124 countries and connect with participants in 55 languages.
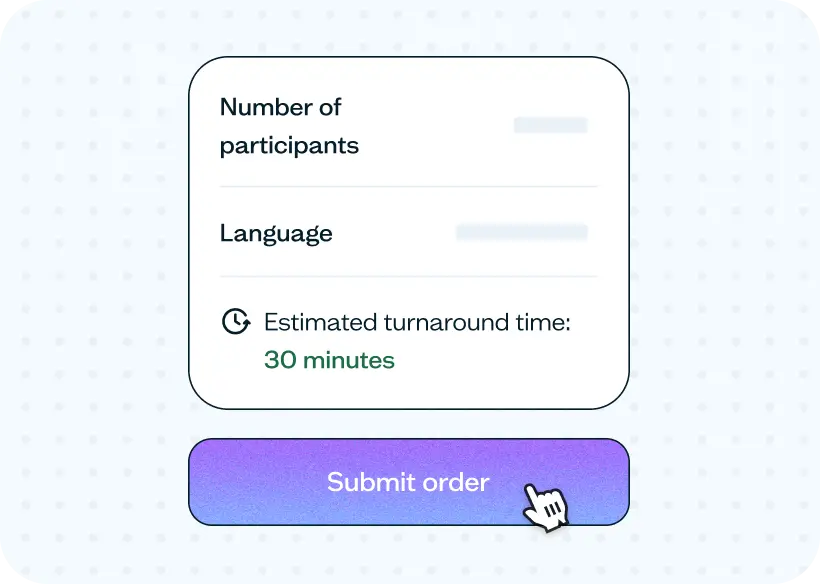
Fast, on-demand recruitment
Complete studies quickly with an average order fulfilled in just 30 minutes.
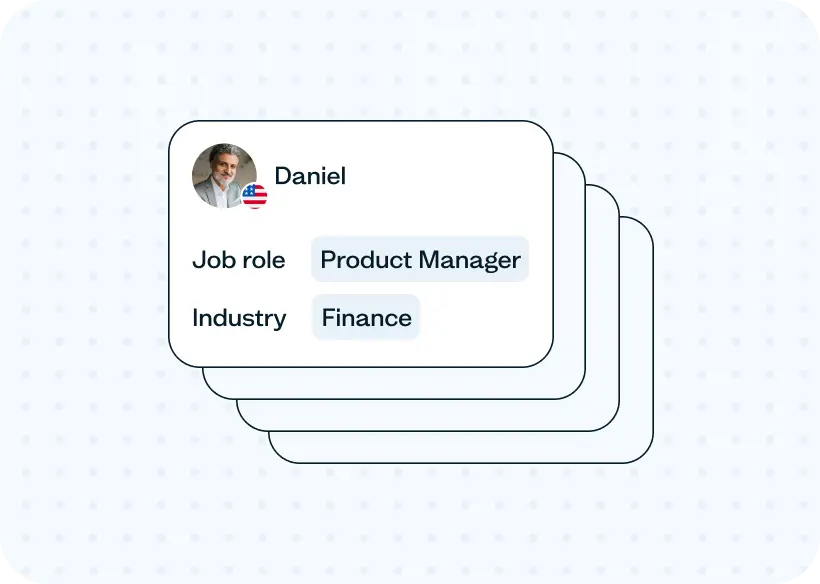
Built for B2B and B2C
Reach both consumer and professional audiences across a wide range of use cases.
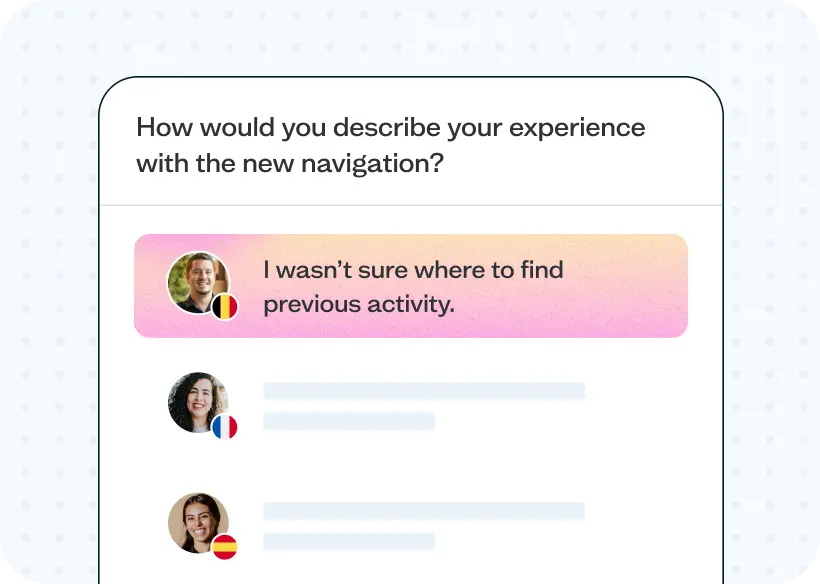
Real people, better data
Thoughtful responses from real participants lead to stronger insights and better decisions.
Find out why users love us
Get started with our resources for card sorting
Guides, templates, and examples to help you design navigation people can actually find their way around.
GUIDE
Card sorting guide
Learn how card sorting reveals how users naturally organize content and build intuitive navigation.
TEMPLATE
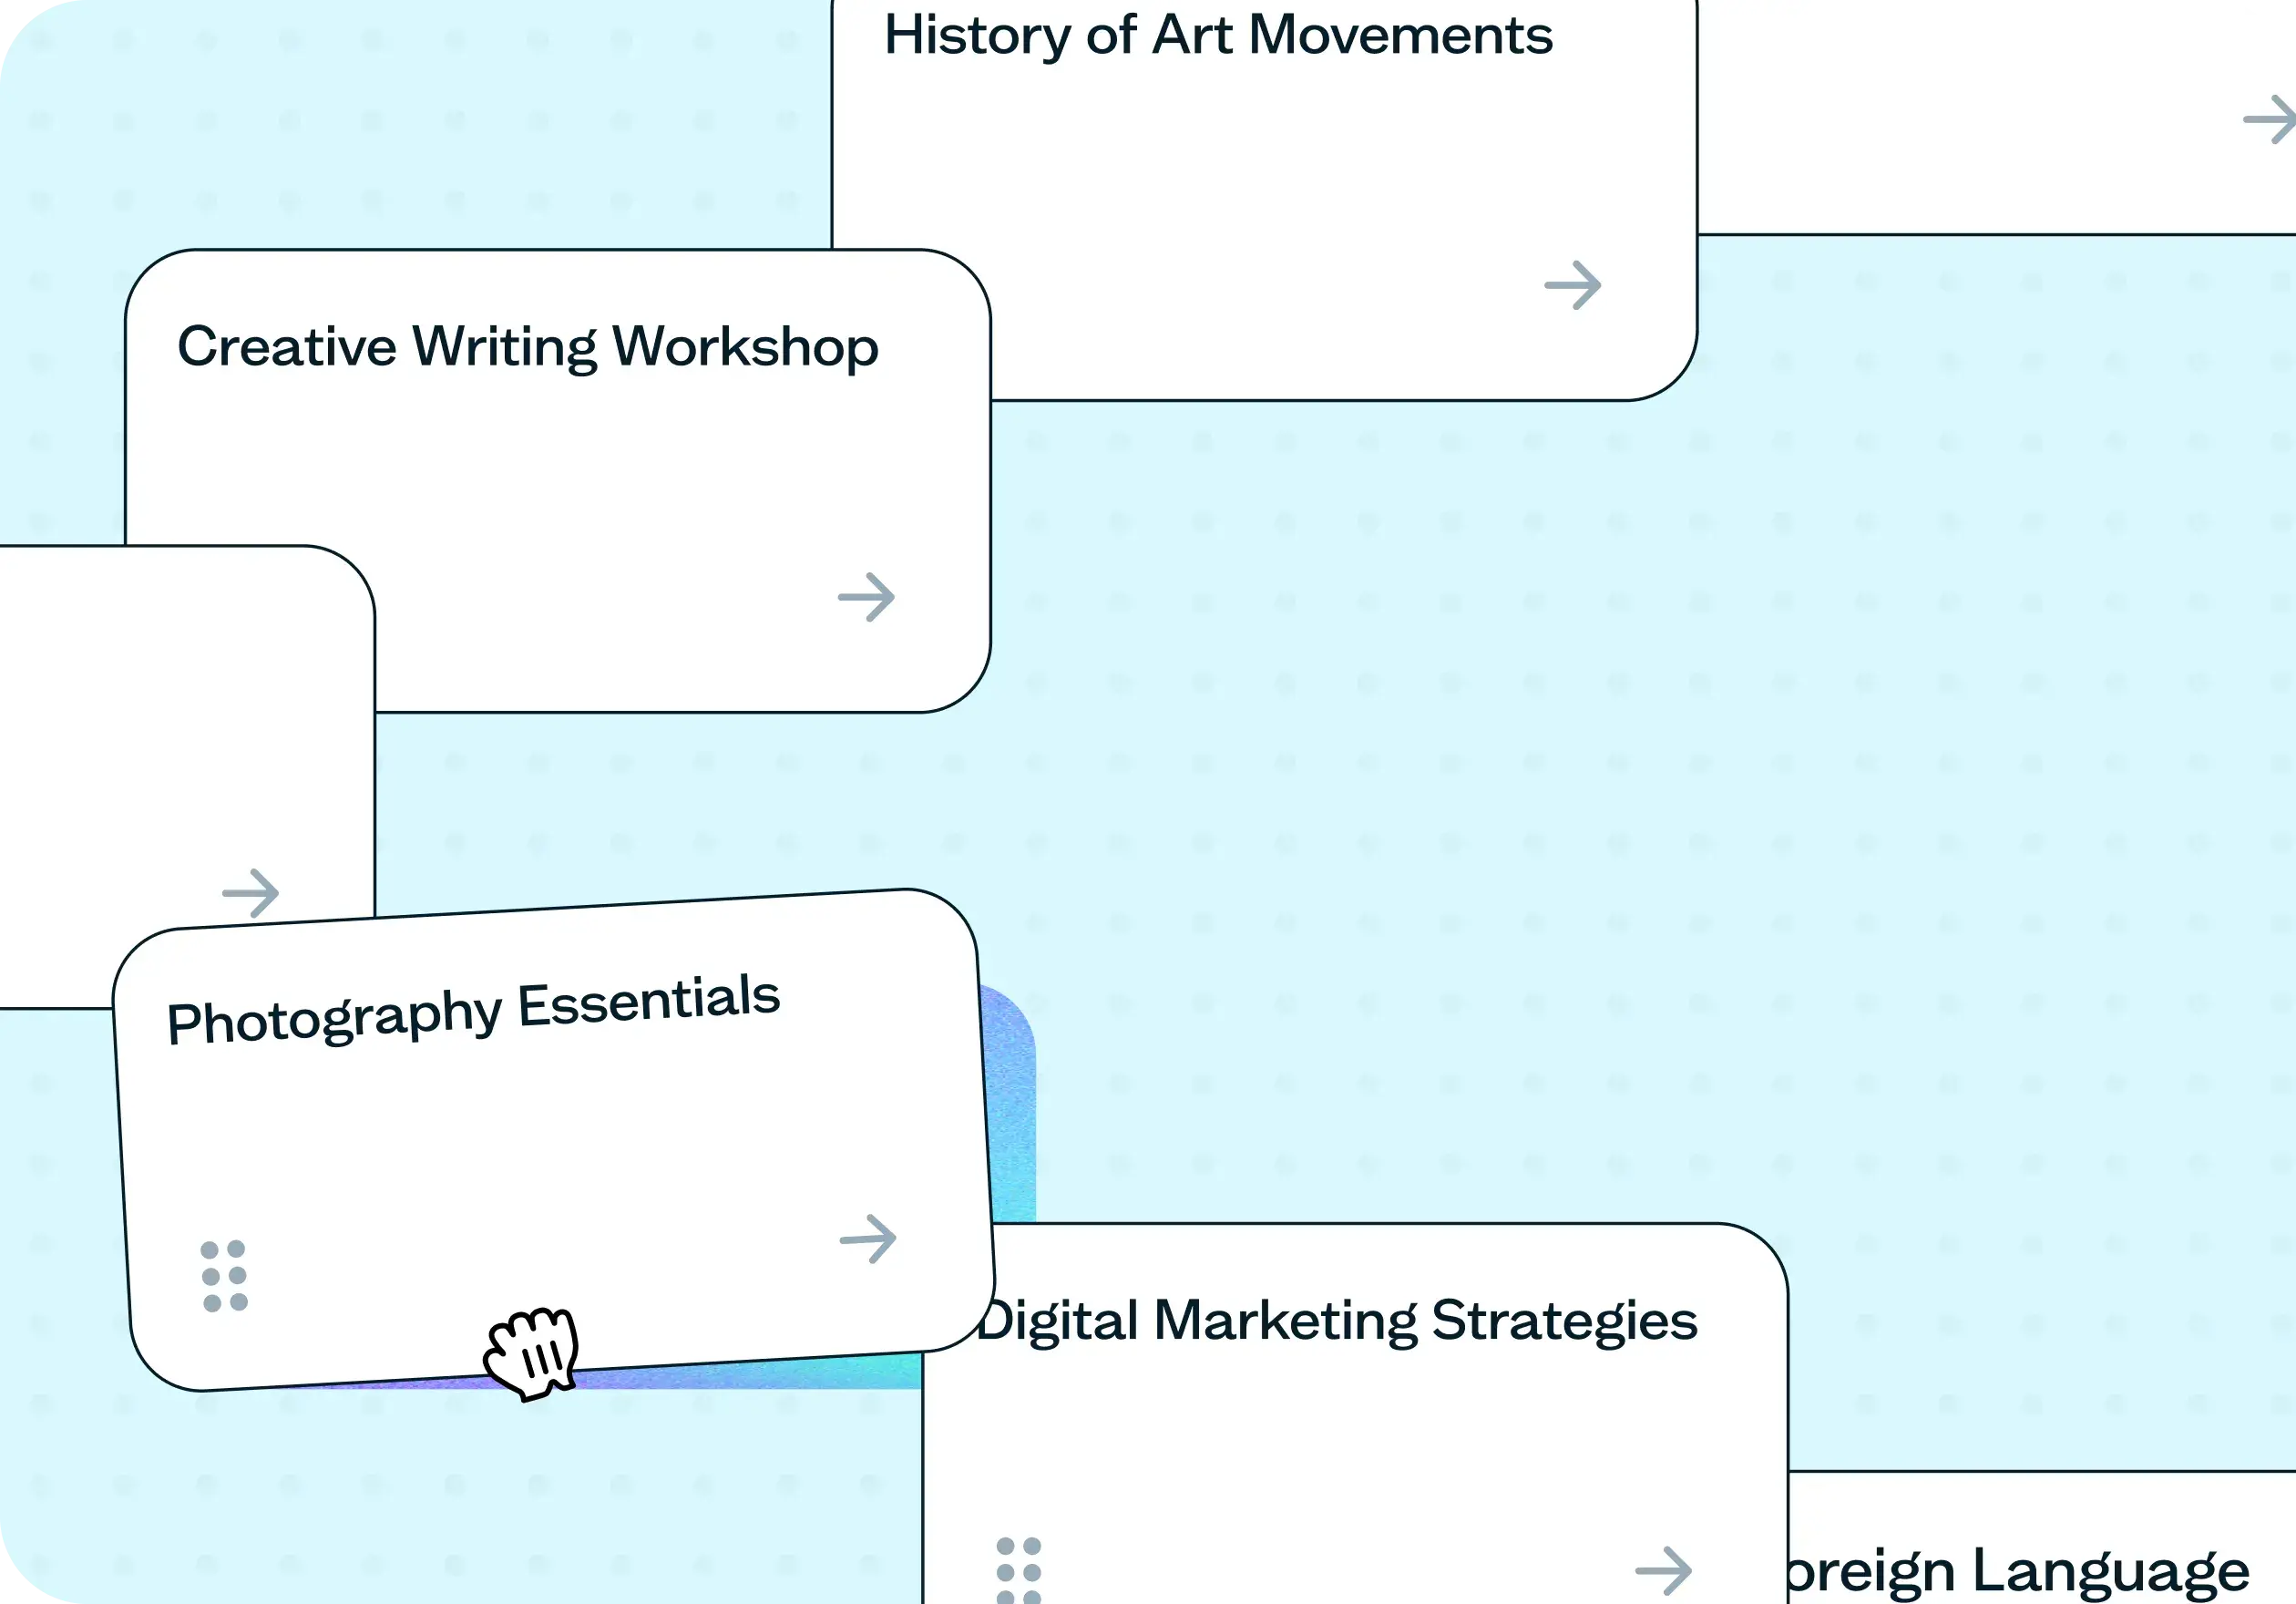
How to optimize your IA with card sorting
Optimize your information architecture with card sorting. Discover how users naturally group your content, what confuses them, and what to prioritize.

ARTICLE
Tree testing vs card sorting
Explore the fundamentals of tree testing and card sorting in UX research. Discover their definitions, methodologies, and the strategic benefits they offer in enhancing user experience.
Frequently asked questions
Card sorting is a user research technique used to gather insights into how users organize information. Participants are presented with a set of cards containing information or items and asked to sort them into groups that make sense to them.
Card sorting can help you create a more effective information architecture by identifying how users think about and organize information. This can lead to clearer and more intuitive navigation, increased user engagement, and reduced development costs.
Lyssna offers three types of card sorting: open, closed, and hybrid.
Open card sorting allows participants to create their own groups and labels, making it useful for exploring how users naturally organize information.
Closed card sorting uses predefined categories, which is helpful for validating an existing structure.
Hybrid card sorting combines both approaches, allowing participants to sort into predefined categories or create their own. This can be useful when you want to validate your structure while still leaving room for new insights.
The method you choose depends on your research goals and whether you're exploring, validating, or doing a bit of both.
The number of participants you need for a card sorting study depends on the complexity of the information and the level of detail you want to achieve. Typically, a sample size of 15–20 participants is recommended. You can use our sample size calculator to find out more here.
There are various methods for analyzing the results of a card sorting exercise. Lyssna offers a variety of built-in data analysis features to simplify the process of analyzing your results. You can view the results in real-time, including participant responses and groupings, and visualize the data using the agreement matrix or similarity matrix. You can also automatically group and filter results.