
Overview
Measure how users experience your product with the System Usability Scale (SUS) — a standardized 10-question survey that produces a single usability score. Use this template to run a prototype test and collect SUS responses in one session, so you can see how users interact with your product and how they feel about it right after.
What is the System Usability Scale (SUS)?
The System Usability Scale is one of the most widely used usability metrics in UX research – and for good reason. Developed by John Brooke in 1986, SUS produces a single score from 0 to 100 that captures how easy, consistent, and learnable users find a product to be.
What makes SUS valuable isn't just the score itself – it's what you can do with it. Because SUS is free, validated, and technology-agnostic, you can apply it to websites, apps, software, hardware, or any service, and compare results against a well-established benchmark. The average SUS score across products is 68. Scores above 68 are above average; scores below signal that usability work is needed.
SUS is also one of the few usability metrics that holds up to scrutiny in stakeholder conversations – a single, meaningful number is far easier to communicate than a stack of qualitative notes.
How to calculate your SUS score
The SUS scoring formula isn't intuitive, which is why miscalculation is common. Here's how it works:
For odd-numbered questions (1, 3, 5, 7, 9): subtract 1 from the participant's response.
For even-numbered questions (2, 4, 6, 8, 10): subtract the participant's response from 5.
Add the adjusted scores for all 10 questions, then multiply the total by 2.5. The result is a score from 0 to 100.
Once you have individual participant scores, you can average them across all respondents – or break them down by demographic group or persona to explore how different user types experience your product.
To save you from doing this manually, we've created a Google Sheets template that does the calculation for you. Download your results as a CSV, import it into the sheet, and your SUS scores are calculated automatically. Instructions are on the first tab.
How to interpret your SUS score
A score of 68 is the industry average across all products. Use these ranges as a guide:
Below 50: Poor usability – significant issues need attention
50–67: Below average – usability improvements are needed
68: The average SUS score across products
68–80: Above average – good usability
Above 80: Excellent usability – top 10% of products
What’s a good SUS score?
An average SUS score is 68, so anything above this could be considered above average and anything below could be considered below average. But the best way to interpret your SUS score is to convert it into a percentile. We cover this in more detail in our article on measuring product usability with the System Usability Scale.
This template will help you discover
SUS gives you a usability signal you can act on. With this template, you'll discover:
Your SUS score, calculated accurately – with automatic scoring via our Google Sheets template
How your product's usability compares to industry benchmarks
Which aspects of the experience users find complex, inconsistent, or hard to learn
How usability changes after design iterations, so you can track the impact of your work
Whether your product meets usability standards for your category
What you'll test
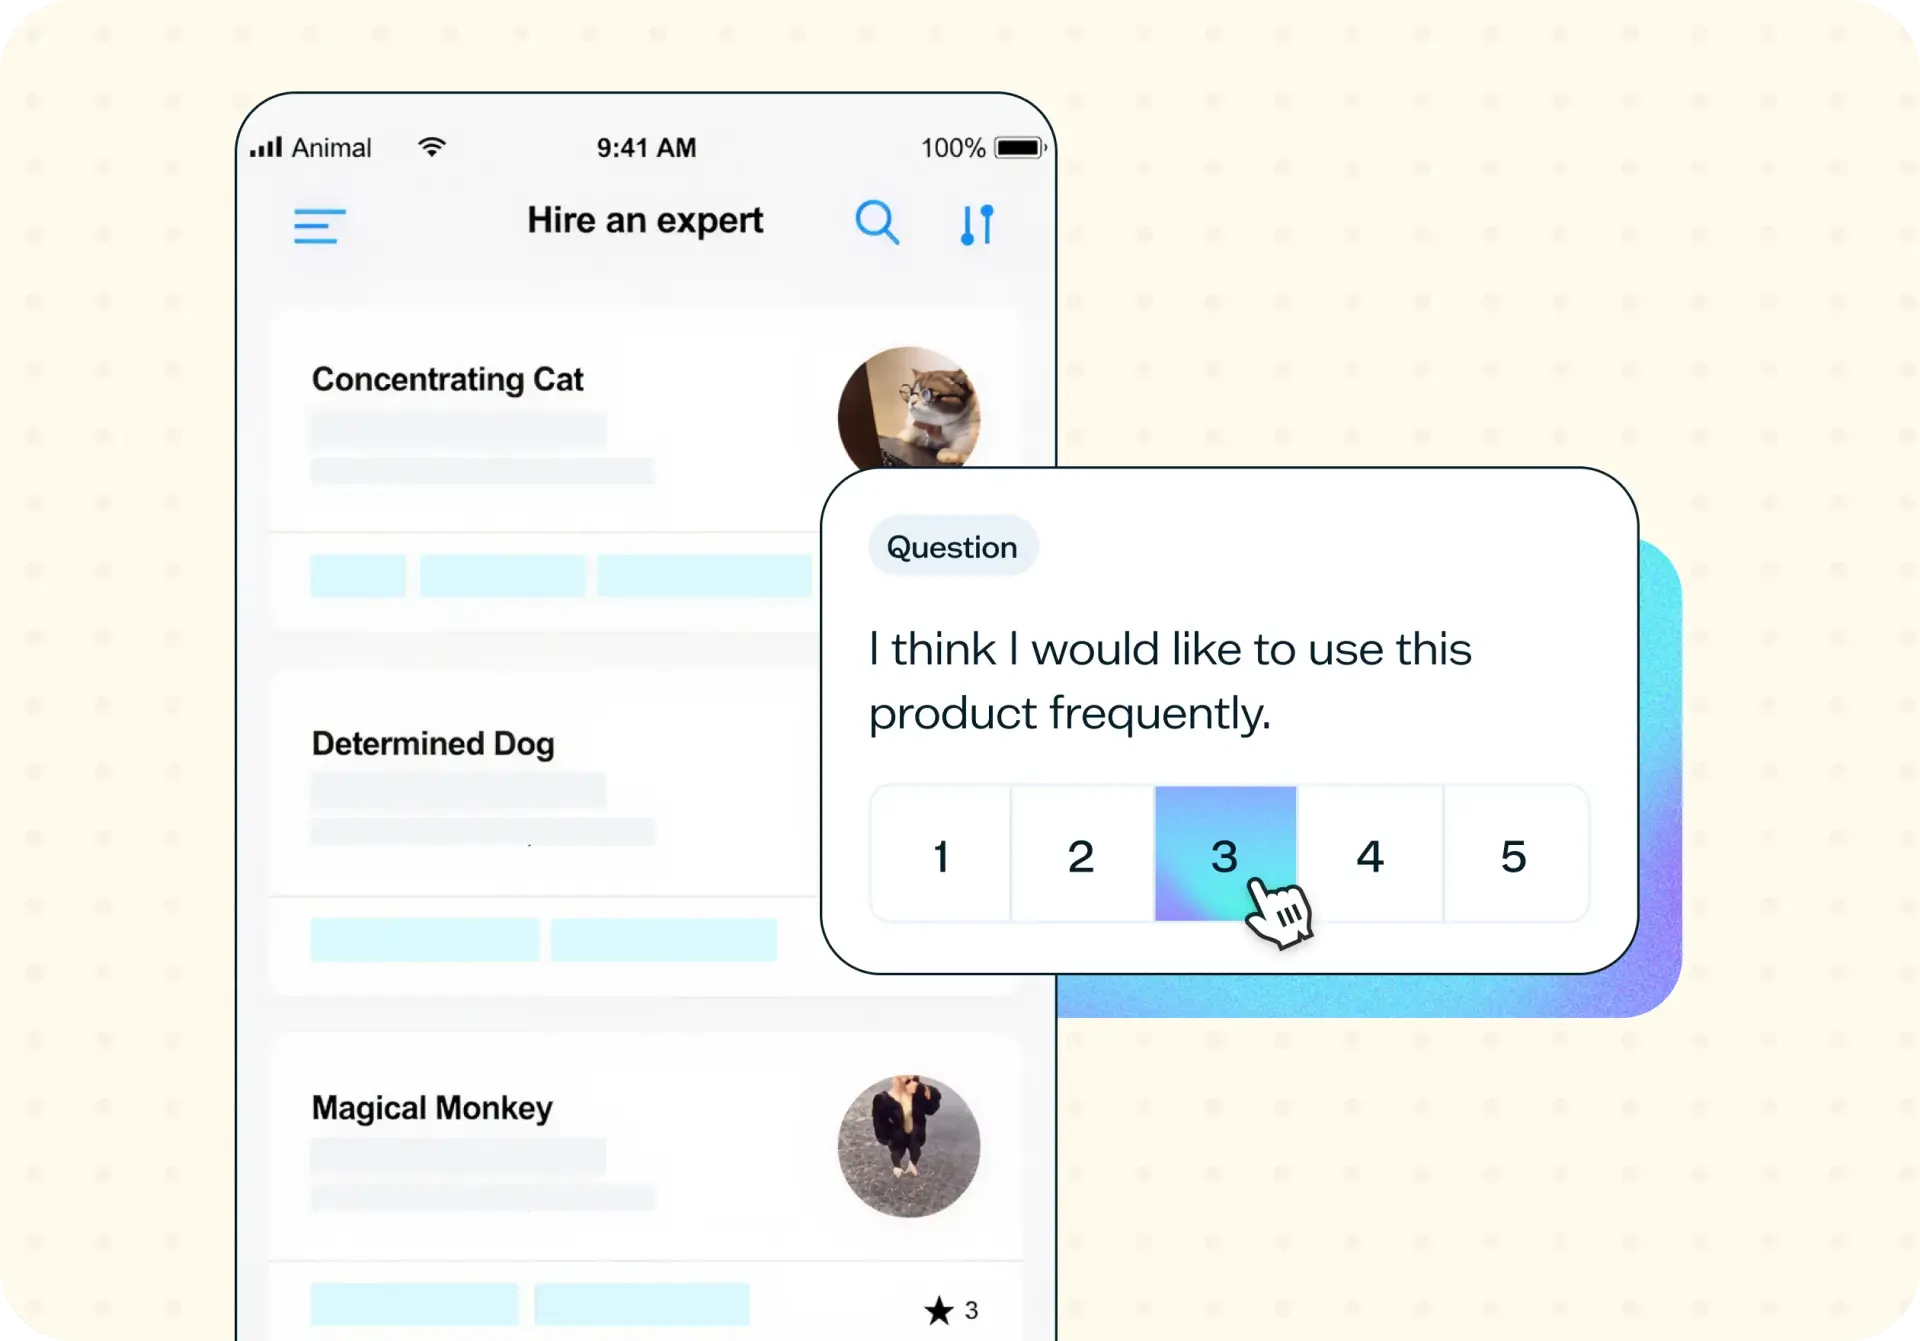
This template combines a prototype test with the 10 SUS survey questions in a single session. After completing a task in your prototype, participants respond to each statement on a scale from 1 (strongly disagree) to 5 (strongly agree).
The statements alternate between positive and negative sentiments, so participants have to engage with each one individually – they can't simply pick the same answer throughout.
Perceived usability: Do users find the product easy to use? Do they feel confident using it without technical support?
Usability consistency: Is the experience consistent across the product? Do users feel the functions are well integrated?
Learnability: How much effort does it take to get started? Would most people pick it up quickly?
When to use this template
This template works across the product life cycle – not just at a single stage:
After usability testing sessions, to quantify your qualitative findings with a recognized metric
Before and after redesigns, to measure whether your iterations improved the experience
During regular product health checks, to maintain a usability baseline over time
When benchmarking against competitors, to understand how your product compares
When stakeholders need a clear, credible number to assess usability and support investment decisions
How to use this template
Click "Use this template" and log in to your Lyssna account. If you don't have an account yet, you can start exploring with a free plan.
Update the prototype test section. Replace the Figma prototype link with your own and update the task instructions to match what you want participants to do.
Leave the SUS survey questions as they are. The 10 questions are standardized – changing the wording invalidates the scoring. They're also set to required, so every participant completes all 10. You need all responses to calculate an accurate SUS score.
Preview your test or save and continue to recruit. Share the test link with participants from your own network, or recruit from the Lyssna research panel.
Wait for your results, then download them as a CSV.
Open our Google Sheets template, make a copy, and import your results. Your SUS scores will be calculated automatically. From there, you can average across all participants or filter by demographic group.

See an example of the results in Lysnna and an example of the SUS score calculations using our Google Sheets template.
Who this template is for
SUS is used across research, design, and product functions – wherever usability needs to be measured and communicated:
UX researchers measuring product usability and tracking it over time
Product managers who need a recognized usability metric for roadmap and reporting conversations
Designers validating whether iterations have improved the experience
QA teams establishing usability baselines as part of broader quality checks
Anyone who needs to make a case for usability work — a SUS score gives you evidence that stakeholders can engage with
Whether you're running your first usability study or building a long-term benchmarking practice, this template gives you a consistent, reliable way to measure what you're building.
FAQs about SUS score calculation
You may also like these templates

We used to spend days collecting the data we can now get in an hour with Lyssna. We're able to get a sneak preview of our campaigns' performance before they even go live.

Aaron Shishler
Copywriter Team Lead at monday.com