12 Feb 2026
|16 min
User experience optimization
Discover user experience optimization strategies that create intuitive, efficient experiences. Learn research methods, metrics, and tools that drive results.
Share on


Share on
User experience optimization is the systematic process of improving how users interact with your product or website to create more intuitive, efficient, and satisfying experiences. Unlike one-time design fixes, UX optimization is an ongoing practice that combines user research, data analysis, and iterative testing to continuously enhance the user journey.
This guide covers everything you need to know about user experience optimization: from understanding how it works to implementing proven strategies that create lasting improvements. We'll explore the role of user research, practical optimization techniques, essential tools, and key performance indicators that help you measure success.
Key takeaways
UX optimization is an ongoing cycle of research, testing, and iteration, not a one-time project. User needs evolve, technology changes, and business goals shift, all requiring continuous attention.
Companies investing in UX see an average ROI of 9,900%, and sites meeting Core Web Vitals thresholds experience 24% less user abandonment.
Effective optimization follows a structured process: discovery and analysis, hypothesis development, design and prototyping, testing and validation, and implementation and monitoring.
Measure success by tracking usability metrics (task completion rate, time on task, error rates), engagement metrics (drop-off and bounce rates), and business metrics (conversion rates, support tickets).
Lyssna helps you run usability tests, card sorts, tree tests, and prototype tests in one platform, with most panel orders fulfilled in under 30 minutes.

How does UX optimization work?
User experience optimization works through a continuous cycle of research, analysis, hypothesis formation, testing, and implementation. Unlike traditional design approaches that rely on assumptions, UX optimization is grounded in data-driven decision making and real user feedback.
Research shows that companies investing in UX see an average ROI of 9,900%, or $100 for every $1 invested. Google research found that sites meeting Core Web Vitals thresholds see 24% less user abandonment, highlighting how critical performance optimization is to user satisfaction.
The optimization process typically follows these key stages:
Discovery and analysis. You gather data on current user behavior through analytics, heatmaps, session recordings, and feedback. This reveals pain points, drop-off locations, and areas where users struggle to complete their goals.
Hypothesis development. Based on your research findings, you form specific hypotheses about what changes might improve the experience. These should be measurable and tied to specific user behaviors or business outcomes.
Design and prototyping. You create solutions that address identified problems, from small interface tweaks to major workflow redesigns. Prototyping allows for quick validation before investing in full development.
Testing and validation. You test solutions with real users through methods like A/B testing, usability testing, and prototype validation. This ensures changes actually improve the experience rather than creating new problems.
Implementation and monitoring. You implement successful changes and continuously monitor them to ensure they maintain their positive impact over time.
Effective UX optimization isn't a one-time project. User needs evolve, technology changes, and business goals shift, all requiring continuous attention to the user experience.

The role of user research in UX optimization
User research forms the foundation of effective UX optimization by providing insights into actual user behavior, needs, and pain points. Without research, optimization efforts risk being based on assumptions that may not reflect real user experiences.
Research function | How it helps |
|---|---|
Understanding user behavior patterns | Research reveals how users actually interact with your product versus how you expect them to. User interviews uncover the "why" behind user actions, while analytics show the "what" and "where." |
Identifying optimization opportunities | Research helps you prioritize which areas need attention most urgently. Usability testing reveals friction points that cause users to abandon tasks, while surveys quantify satisfaction levels across segments. |
Validating optimization hypotheses | Before implementing changes, research validates whether proposed solutions actually address user needs. Prototype testing lets you test concepts quickly and affordably before full development. |
Measuring optimization impact | Research provides both quantitative and qualitative measures of success. Task completion rates, error rates, and time-on-task show functional improvements, while satisfaction scores reveal emotional responses. |
Continuous discovery | Ongoing research ensures optimization efforts remain aligned with evolving user needs. Regular continuous product discovery and periodic usability assessments help you stay ahead of emerging issues. |
Methods like card sorting and navigation testing help you understand how users expect information to be organized, ensuring your optimization efforts improve rather than complicate the user experience.
Practitioner insight: "A full-blown research project can take a lot of time and energy, but you can have meaningful early results from Lyssna in a single day. I think that's one of the best benefits I've seen: faster and better iteration."
– Alan Dennis, Product Design Manager at YNAB
How to optimize UX
Optimizing user experience requires a structured approach that combines user research, data analysis, and iterative testing. Here's a process for implementing effective UX optimization:
Conduct user research. Gather data on how users interact with your product. Use surveys to uncover preferences, user interviews to explore motivations, and analytics to identify patterns. This research forms the foundation for all optimization decisions.
Develop user personas. Create detailed profiles of your target users based on research findings. Personas help ensure optimization efforts remain focused on actual user needs rather than internal assumptions.
Design and prototype. Create solutions that address identified problems, starting with low-fidelity concepts and progressing to interactive prototypes. Focus on solving specific user problems rather than making changes for aesthetic reasons alone.
Perform usability testing. Test your designs with real users to validate that changes actually improve the experience. Use both moderated and unmoderated testing to gather comprehensive feedback.
Iterate and implement. Based on testing results, refine your designs through product iteration and implement successful changes. Continue monitoring user behavior and satisfaction to ensure optimizations maintain their positive impact.
This process should be ongoing rather than a one-time effort. User needs evolve, technology changes, and business goals shift, all requiring continuous attention to user experience optimization.

User experience optimization tips
Effective UX optimization requires attention to multiple aspects of the user experience. Here are proven strategies that can significantly improve user satisfaction and business outcomes.
Tip | Why it matters |
|---|---|
1. Simplify navigation | Reduces navigational fatigue and bounce rates |
2. Improve page load speed | Sites meeting Core Web Vitals see 24% less abandonment |
3. Make it mobile-friendly | Mobile accounts for over half of web traffic |
4. Use clear calls to action | Guides users toward conversions without confusion |
5. Maintain consistency | Reduces cognitive load and builds predictability |
6. Prioritize content readability | Helps users scan and understand content quickly |
7. Incorporate visual hierarchy | Directs attention to what matters most |
8. Enhance accessibility | Benefits all users and expands your audience |
9. Provide feedback and affordances | Helps users understand system status and interactions |
10. Limit pop-ups and intrusions | Prevents frustration while still capturing conversions |
11. Use high-quality visuals | Supports user goals without distraction |
12. Gather continuous user feedback | Catches emerging issues before they escalate |
Simplify navigation
Complex navigation structures confuse users and increase task completion time. Navigational fatigue is real, and when your site has a complex hierarchy, users quickly tire of expanding sub-menu after sub-menu.
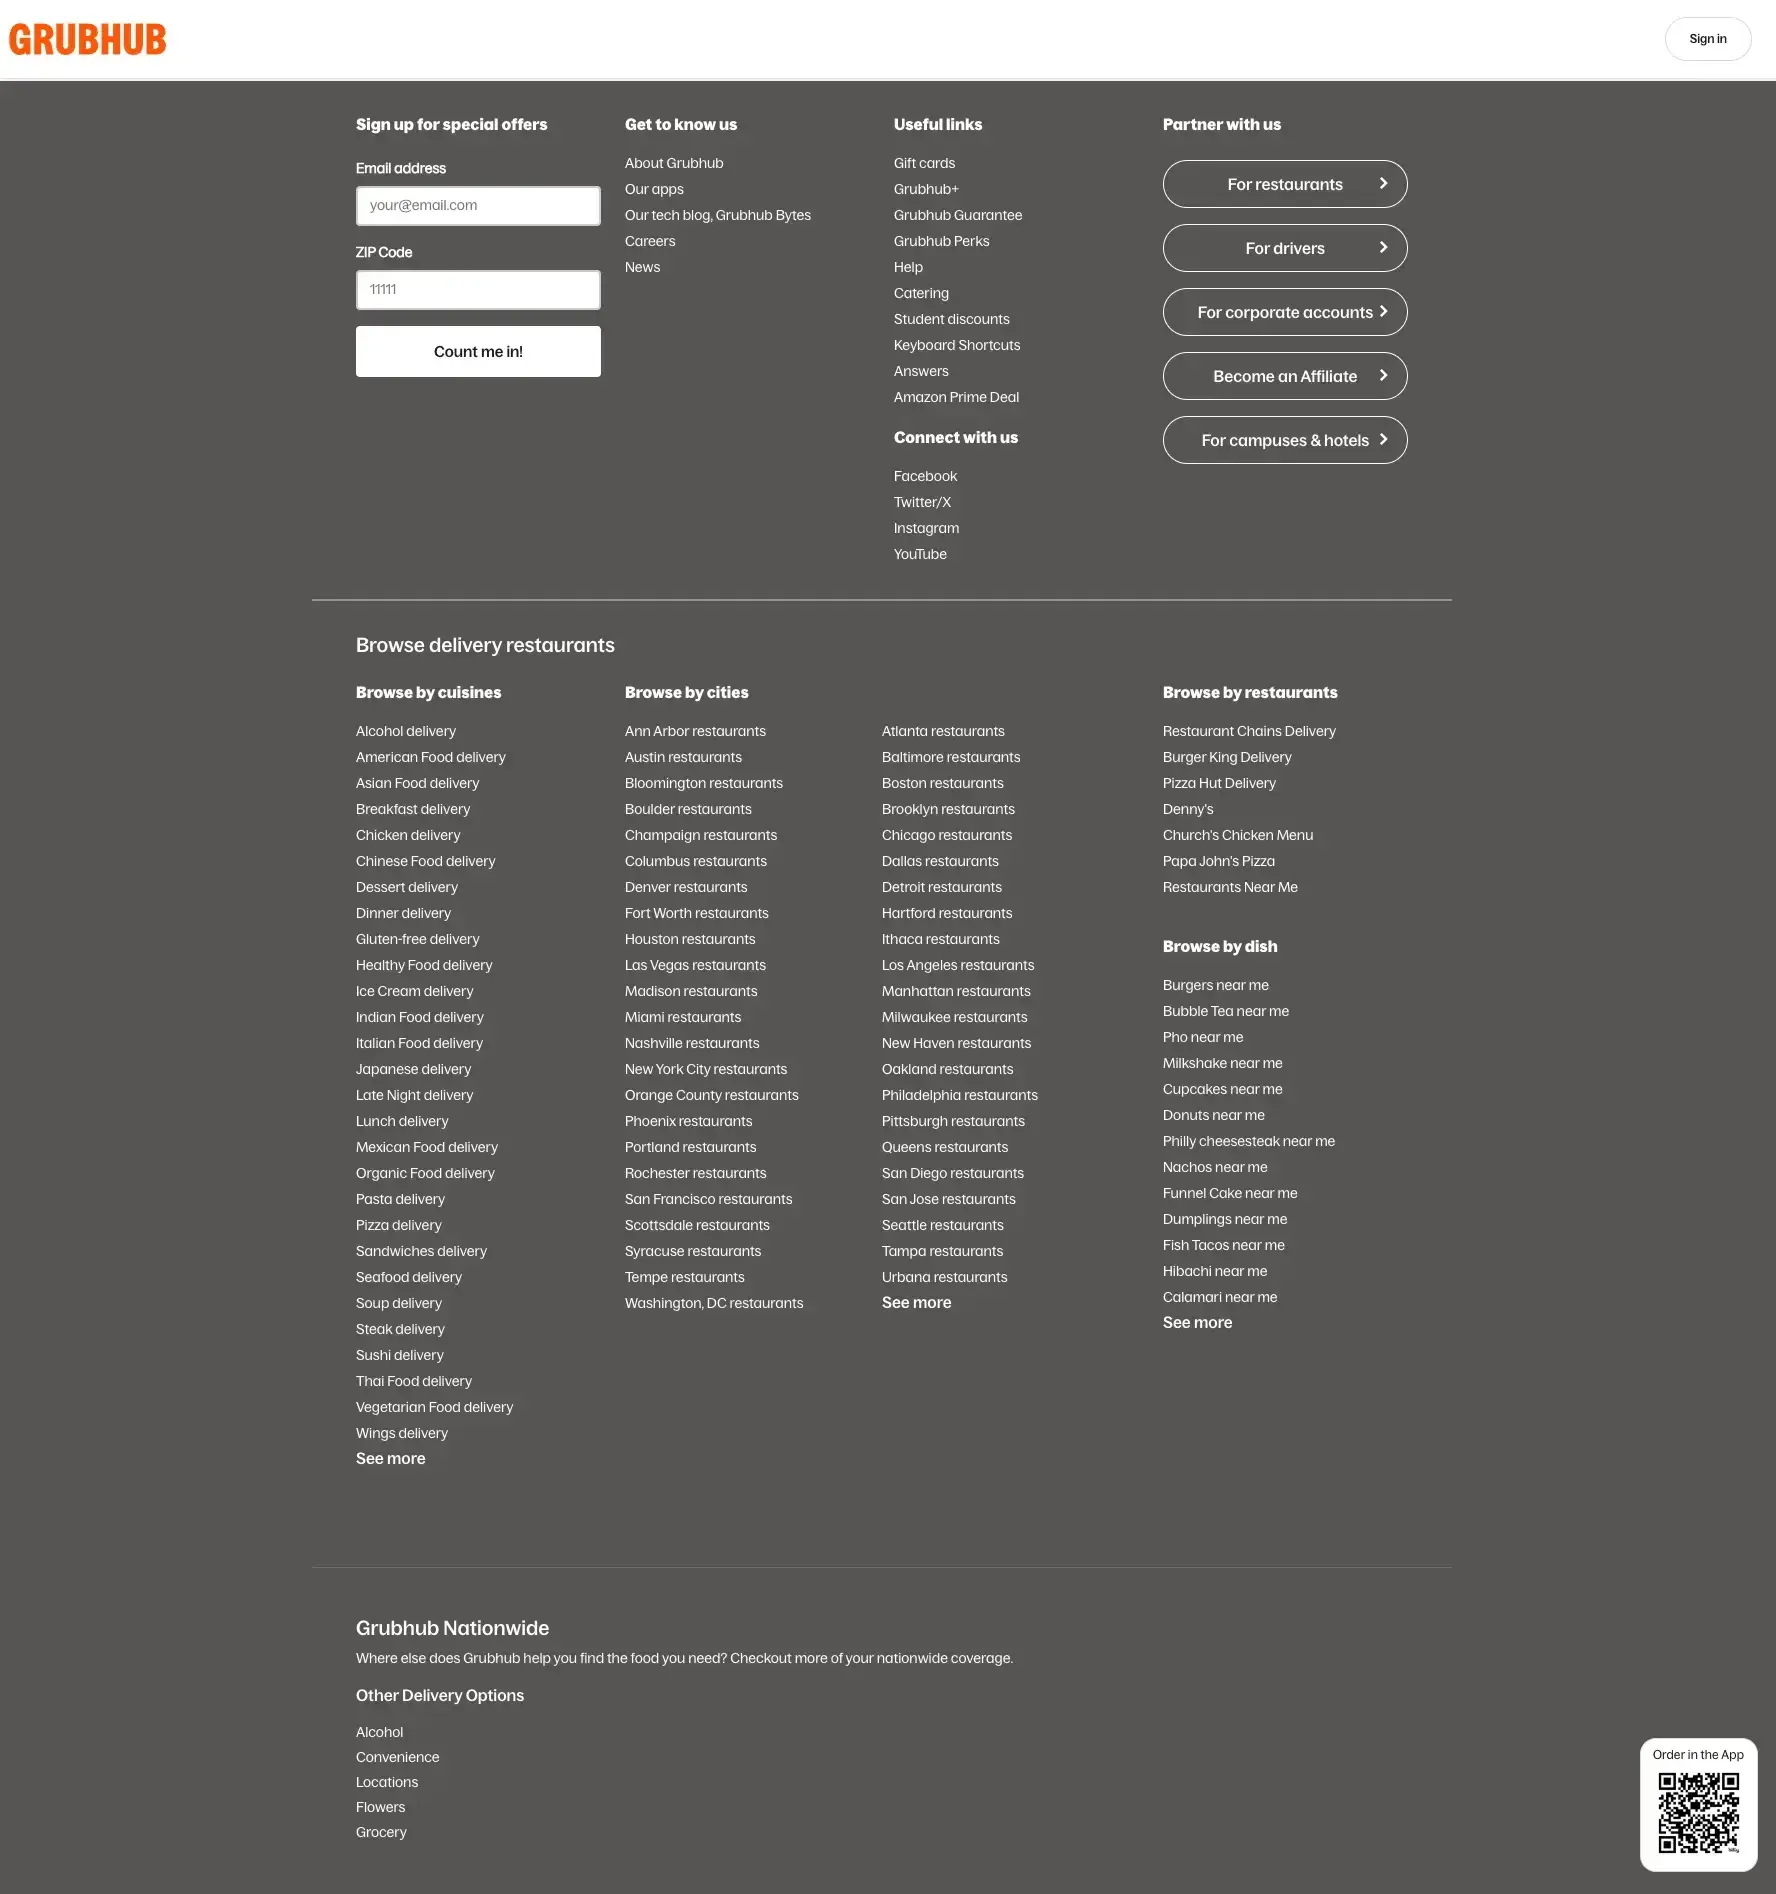
Mega footers are an effective solution. They provide navigation links to all important pages, so users can quickly jump to exactly what they're looking for. Including a mega footer can positively impact your bounce rate and overall conversion rate. It's also a great place to incorporate important keywords to improve your search engine rankings. Take inspiration from GrubHub's mega footer: if you're trying to rank for specific locations, including them in your footer helps with local SEO without cluttering your main menu.
Pro tip: Run a tree test to validate your navigation structure before redesigning, or use card sorting to discover how users expect information to be grouped.
Improve page load speed
Page performance directly impacts user satisfaction and business outcomes. As stated earlier, Google research found that sites meeting Core Web Vitals thresholds see 24% less user abandonment. Optimize images, minimize code, use content delivery networks, and regularly audit your site's performance to ensure fast loading times across all devices.
Pro tip: Use Google's PageSpeed Insights to get a baseline score, then prioritize fixes by impact. Image compression and lazy loading often deliver the biggest wins with the least effort.
Make it mobile-friendly
With mobile traffic accounting for over half of web usage, mobile optimization is essential. Ensure your interface works seamlessly across different screen sizes, touch targets are appropriately sized, and content remains readable without zooming.
Use clear calls to action
Effective calls to action guide users toward desired outcomes without confusion. Strong CTAs share these qualities:
Action-oriented. Use verbs like subscribe, download, or book a demo.
Urgent. Use commanding words that imply the risk of waiting.
Value-driven. Communicate the benefit, such as "Download this free guide" or "Start your free trial."
Low-risk. Reduce hesitation with phrases like "Start your free trial" or "No credit card required."
Visible. Use white space and color to make it stand out.
Empowering. Make the user feel in control of their next step.
Pro tip: A/B test your CTA copy and button color separately. Changing both at once makes it impossible to know which variable drove the result.
Maintain consistency
Consistent design patterns reduce cognitive load and help users predict how interface elements will behave. Establish design systems that ensure consistent typography, colors, spacing, and interaction patterns across your entire product.
Prioritize content readability
Content should be easy to scan and understand. Use clear headings, short paragraphs, bullet points, and adequate white space to improve readability. Choose fonts and colors that provide sufficient contrast for accessibility.
Incorporate visual hierarchy
Visual hierarchy guides users' attention to the most important elements first. Use size, color, contrast, and positioning to create clear information hierarchies that support user goals and business objectives.
Pro tip: Run a five second test to check whether users notice your most important elements. If they can't recall your key message or CTA after a quick glance, your hierarchy needs work.
Enhance accessibility
Accessible design benefits all users, not just those with disabilities. Follow WCAG guidelines for color contrast, keyboard navigation, screen reader compatibility, and alternative text for images.
Provide feedback and affordances
Users need clear feedback about their actions and system status. Provide loading indicators, confirmation messages, error explanations, and visual cues that help users understand how to interact with interface elements.
Limit pop-ups and intrusions
While pop-ups can be effective for conversions, they can also frustrate users. Use them strategically, with clear value propositions and easy dismissal options.
Use high-quality visuals
Visual elements should support rather than distract from user goals. Use high-quality images, consistent illustration styles, and purposeful graphics that enhance understanding and engagement.
Gather continuous user feedback
Regular feedback collection helps identify emerging issues before they become major problems. Implement feedback widgets, conduct periodic surveys, and monitor support requests to stay informed about user needs and frustrations.
Pro tip: Set up a recurring survey to track user satisfaction over time. Comparing results quarter over quarter helps you spot trends before they become problems.

Best practices for user experience optimization
While the tips above address specific areas of your interface, sustainable UX optimization also requires following broader principles that guide your overall approach. These best practices ensure your efforts create lasting improvements rather than temporary fixes.
Keep user needs first. Every optimization decision should be grounded in actual user needs rather than internal preferences or assumptions. Before implementing any change, ask: "What user problem does this solve?" If you can't answer clearly, go back to your research. Ongoing user interviews help you stay connected to what your users actually need, not what you assume they need.
Practitioner insight: "Adopting Lyssna got us into the habit of asking our users questions before locking in decisions."
– Ron Diorio, VP Innovation & New Products at The Economist Group
Stay updated with UX trends. User expectations evolve as technology advances and new interaction patterns emerge. Follow industry publications, attend webinars, and review competitor experiences quarterly to stay informed, but always validate trends against your users' specific needs before adopting them.
Monitor and analyze user behavior. Set up weekly reviews of your analytics, heatmaps, and session recordings. Look for patterns like repeated rage clicks, unexpected drop-offs, or features users ignore entirely. These signals often reveal friction points that surveys miss.
Regularly test and refine. Establish a testing cadence, whether that's monthly usability tests, quarterly prototype testing, or continuous A/B experiments. Document what you learn and revisit past findings when planning new features.
Provide excellent support. Audit your support channels to ensure they're easy to find and use. Track common support requests and feed those insights back into your optimization roadmap. Recurring issues are often symptoms of deeper UX problems.
[Info tip] Pro tip: Schedule a monthly "UX walkthrough" where your team navigates your product as a new user would. Fresh eyes often catch friction points that become invisible over time.
These best practices create a foundation for sustainable UX optimization that adapts to changing user needs and business requirements over time.
User experience optimization tools
Effective UX optimization requires the right tools to research user behavior, test solutions, and measure results. Here's an overview of essential tool categories and recommendations:
Tool category | Purpose | Examples | Best for |
|---|---|---|---|
User research platforms | Conduct usability testing, surveys, and user interviews | Lyssna, UserTesting, Maze | Comprehensive user research and validation |
Analytics tools | Track user behavior and identify optimization opportunities | Google Analytics, Adobe Analytics, Mixpanel | Understanding user behavior patterns |
Heatmap tools | Visualize user interactions and attention patterns | Hotjar, Crazy Egg, FullStory | Identifying interaction hotspots and problem areas |
A/B testing platforms | Test different versions of designs or content | Optimizely, VWO, AB Tasty | Validating optimization hypotheses |
Prototyping tools | Create interactive prototypes for testing | Figma, Sketch, Adobe XD, InVision | Rapid prototyping and design iteration |
Survey tools | Collect user feedback and satisfaction data | Lyssna, Typeform, SurveyMonkey, Qualtrics | Gathering quantitative user feedback |
Session recording | Watch actual user sessions to identify friction points | LogRocket, FullStory, Hotjar | Understanding user behavior in detail |
Performance monitoring | Track page load times and technical performance | GTmetrix, PageSpeed Insights, Pingdom | Optimizing technical performance |
Additional specialized tools:
Card sorting: Lyssna, OptimalSort, UserZoom for information architecture optimization
Tree testing: Lyssna, Treejack for navigation structure validation
Accessibility testing: WAVE, axe DevTools, Lighthouse for ensuring inclusive design
Form analytics: Hotjar Form Analysis, Zuko for optimizing form completion rates
Customer feedback: Thematic, Medallia, Qualtrics CustomerXM for enterprise feedback management
Voice of customer: Qualtrics, Medallia for analyzing qualitative feedback at scale
The key is choosing tools that align with your specific optimization goals, team size, and budget constraints while providing actionable insights that drive meaningful improvements.
Practitioner insight: "Previously, a lot of UX tools would only let you run one study type at a time - Lyssna changed the game here. Being able to run a card sort and a tree test or first click task within a single study helps to get to navigation insights much quicker at a lower cost than trying to do all of these separately."
– Verified User in Hospitality
User experience optimization KPIs
Measuring the success of UX optimization efforts requires tracking both quantitative metrics and qualitative indicators that reflect user satisfaction and business impact. Here are the essential KPIs to monitor:
KPI | What it measures |
|---|---|
Task completion rate | Whether users can achieve their goals |
Time on task | How efficiently users complete tasks |
Drop-off rates | Where users abandon processes |
User satisfaction scores | Direct feedback on user perception (NPS, CSAT) |
Error rates | How often users make mistakes |
Conversion rates | Business-critical actions completed |
Page load times | Technical performance |
Bounce rates | Whether landing pages meet expectations |
Customer support tickets | Usability issues surfaced through support |
Return user rates | Whether users come back |
Usability metrics
Usability metrics reveal how effectively users can navigate your product and complete their goals.
Task completion rate. How many users can successfully achieve their goals? This fundamental metric reveals whether your optimization efforts are actually helping users accomplish what they came to do. Track completion rates for key user journeys and monitor improvements over time.
Time on task. Are users completing tasks efficiently, or are they spending too much time figuring things out? Reduced task completion time often indicates improved usability, though be careful to ensure speed doesn't come at the expense of accuracy or user satisfaction.
Error rates. How often do users make mistakes or encounter errors? High error rates suggest interface elements are confusing or misleading and need clarification.
Engagement metrics
These metrics show how users interact with your product and whether they find enough value to stay or return.
Drop-off rates. Where do users abandon processes, like filling out forms or checking out? High drop-off rates at specific steps indicate friction points that need optimization attention.
Bounce rates. High bounce rates may indicate that landing pages don't meet user expectations or that the initial experience is confusing or irrelevant.
Return user rates. Users who return to your product after their first visit demonstrate positive experiences and successful value delivery.
Business metrics
These metrics connect UX improvements to outcomes that impact your bottom line.
Conversion rates. For business-critical actions like purchases, sign-ups, or downloads, track how optimization efforts impact conversion rates across different user segments and traffic sources.
Customer support tickets. Reductions in support requests related to usability issues can indicate successful optimization efforts, while increases may signal new problems.
Feedback metrics
These metrics capture what users think and feel about their experience in their own words.
User satisfaction scores. Net Promoter Score (NPS), Customer Satisfaction (CSAT), and custom satisfaction surveys provide direct feedback about user perceptions of your product experience.
Technical metrics
These metrics track performance factors that directly influence user experience.
Page load times. Technical performance directly impacts user experience. Monitor Core Web Vitals and other performance metrics to ensure optimization efforts don't negatively impact speed.
These KPIs should be tracked consistently over time and segmented by user type, traffic source, and device to provide actionable insights for continued optimization efforts.

Optimize your UX with Lyssna
Lyssna provides a comprehensive platform for user experience optimization, combining multiple research methods in one integrated solution:
690,000+ panel participants
395+ demographic attributes
30 min average fulfillment
$1 per response, per minute
With precise targeting and unlimited tests on every plan, Lyssna makes user research accessible for teams of all sizes.
Rapid user research. Most panel orders are fulfilled in under 30 minutes, so you can maintain momentum in optimization cycles.
Comprehensive testing methods. Run usability tests, card sorts, tree tests, preference tests, and prototype tests, all in one platform.
Integrated analysis tools. Built-in analytics help you identify patterns and extract insights without exporting to separate tools.
Collaborative features. Share findings through automated reports and collaborative workspaces.
Whether you're identifying optimization opportunities or validating solutions before implementation, Lyssna provides the tools and participant access you need to make user-centered decisions efficiently.
Building user experiences that last
Creating sustainable user experiences requires thinking beyond immediate optimization wins to build systems and practices that adapt to changing user needs over time. Long-term UX success comes from establishing processes that continuously evolve with your users and business.
Establish design systems. Create component libraries, style guides, and interaction patterns that reduce cognitive load for users and development overhead for teams.
Build feedback loops. Implement multiple channels for ongoing feedback, from in-app widgets to periodic research studies, so you catch issues early.
Create cross-functional collaboration. Establish regular collaboration between design, development, product, and support teams to ensure user insights inform all decisions.
Document optimization learnings. Record what worked and what didn't. This prevents repeating failed experiments and helps new team members understand past decisions.
Plan for scalability. Design solutions that accommodate growth in users, content, and functionality as your product evolves.
Invest in team capabilities. Ensure your team has the skills, tools, and training needed for effective research and optimization.
Monitor the competitive landscape. Track how user expectations evolve based on other products so your optimization efforts keep pace.
By focusing on sustainable practices rather than quick fixes, you create user experiences that remain effective and satisfying as both your product and your users evolve over time.
FAQs about user experience optimization

Pete Martin
Content writer
Pete Martin is a content writer for a host of B2B SaaS companies, as well as being a contributing writer for Scalerrs, a SaaS SEO agency. Away from the keyboard, he’s an avid reader (history, psychology, biography, and fiction), and a long-suffering Newcastle United fan.
You may also like these articles