This template is for:
User feedback
Product development
Marketing
Product
Surveys
Created by:
Lyssna
Overview
Collect structured feedback from churned customers to understand what drove them away – and what could have made them stay. This template combines multiple-choice, Likert scale, and open-ended questions to surface the pain points, unmet expectations, and competitor comparisons that sit behind every cancellation.
The problem with ignoring customer churn
Most teams know their churn rate. Far fewer know the real reasons behind it.
When users cancel or go quiet, it's tempting to rely on product analytics to explain why – but analytics show what happened, not why it happened. Drop-off metrics can tell you where users stopped engaging, but they can't tell you whether the product felt too expensive, whether a key feature never worked the way users expected, or whether a competitor made a compelling offer at exactly the right moment.
Without that direct feedback, decisions are based on assumptions. The wrong features get prioritized. Pricing changes that seemed reasonable turn out to have been the final straw. Retention efforts target the wrong segments. And the customers who left – who could have stayed, or come back – are never heard from.
Churn surveys close that gap. They capture feedback while the experience is still fresh, making patterns visible across many users so your team can fix the problems that actually matter.
This template will help you discover
This template is designed to surface the real drivers of customer loss – not just the surface-level reasons users give, but the expectations, comparisons, and missed moments that sit beneath them:
Why customers cancel or stop using your product.
How users perceive your pricing, features, and overall value.
Which competitors users switch to, and what drew them there.
What expectations weren't met across the customer journey.
Where the experience breaks down – from onboarding to day-to-day use.
What could have prevented churn, or what might bring users back.
Churn surveys combine qualitative and quantitative feedback to give your team a complete picture of customer loss – not just trends, but the reasoning behind them.
What you'll test
Reasons for leaving: Why users cancelled – whether that's pricing, missing features, usability issues, or a change in their circumstances.
Perceived value: Whether the product felt worth the cost, and where the gap between price and value widened.
Expectations vs reality: What users came expecting and where the product didn't deliver on those expectations.
Competitor comparison: Where users went after leaving, and what those alternatives offered that yours didn't.
Retention opportunities: What would have made a difference – the changes, features, or moments of support that could have kept users engaged.
How the research works
This template uses a mix of survey question types to capture both measurable trends and deeper user reasoning.
Exit survey questions capture feedback at the point of cancellation or shortly after, when the experience and the reasons for leaving are still clear in the user's mind.
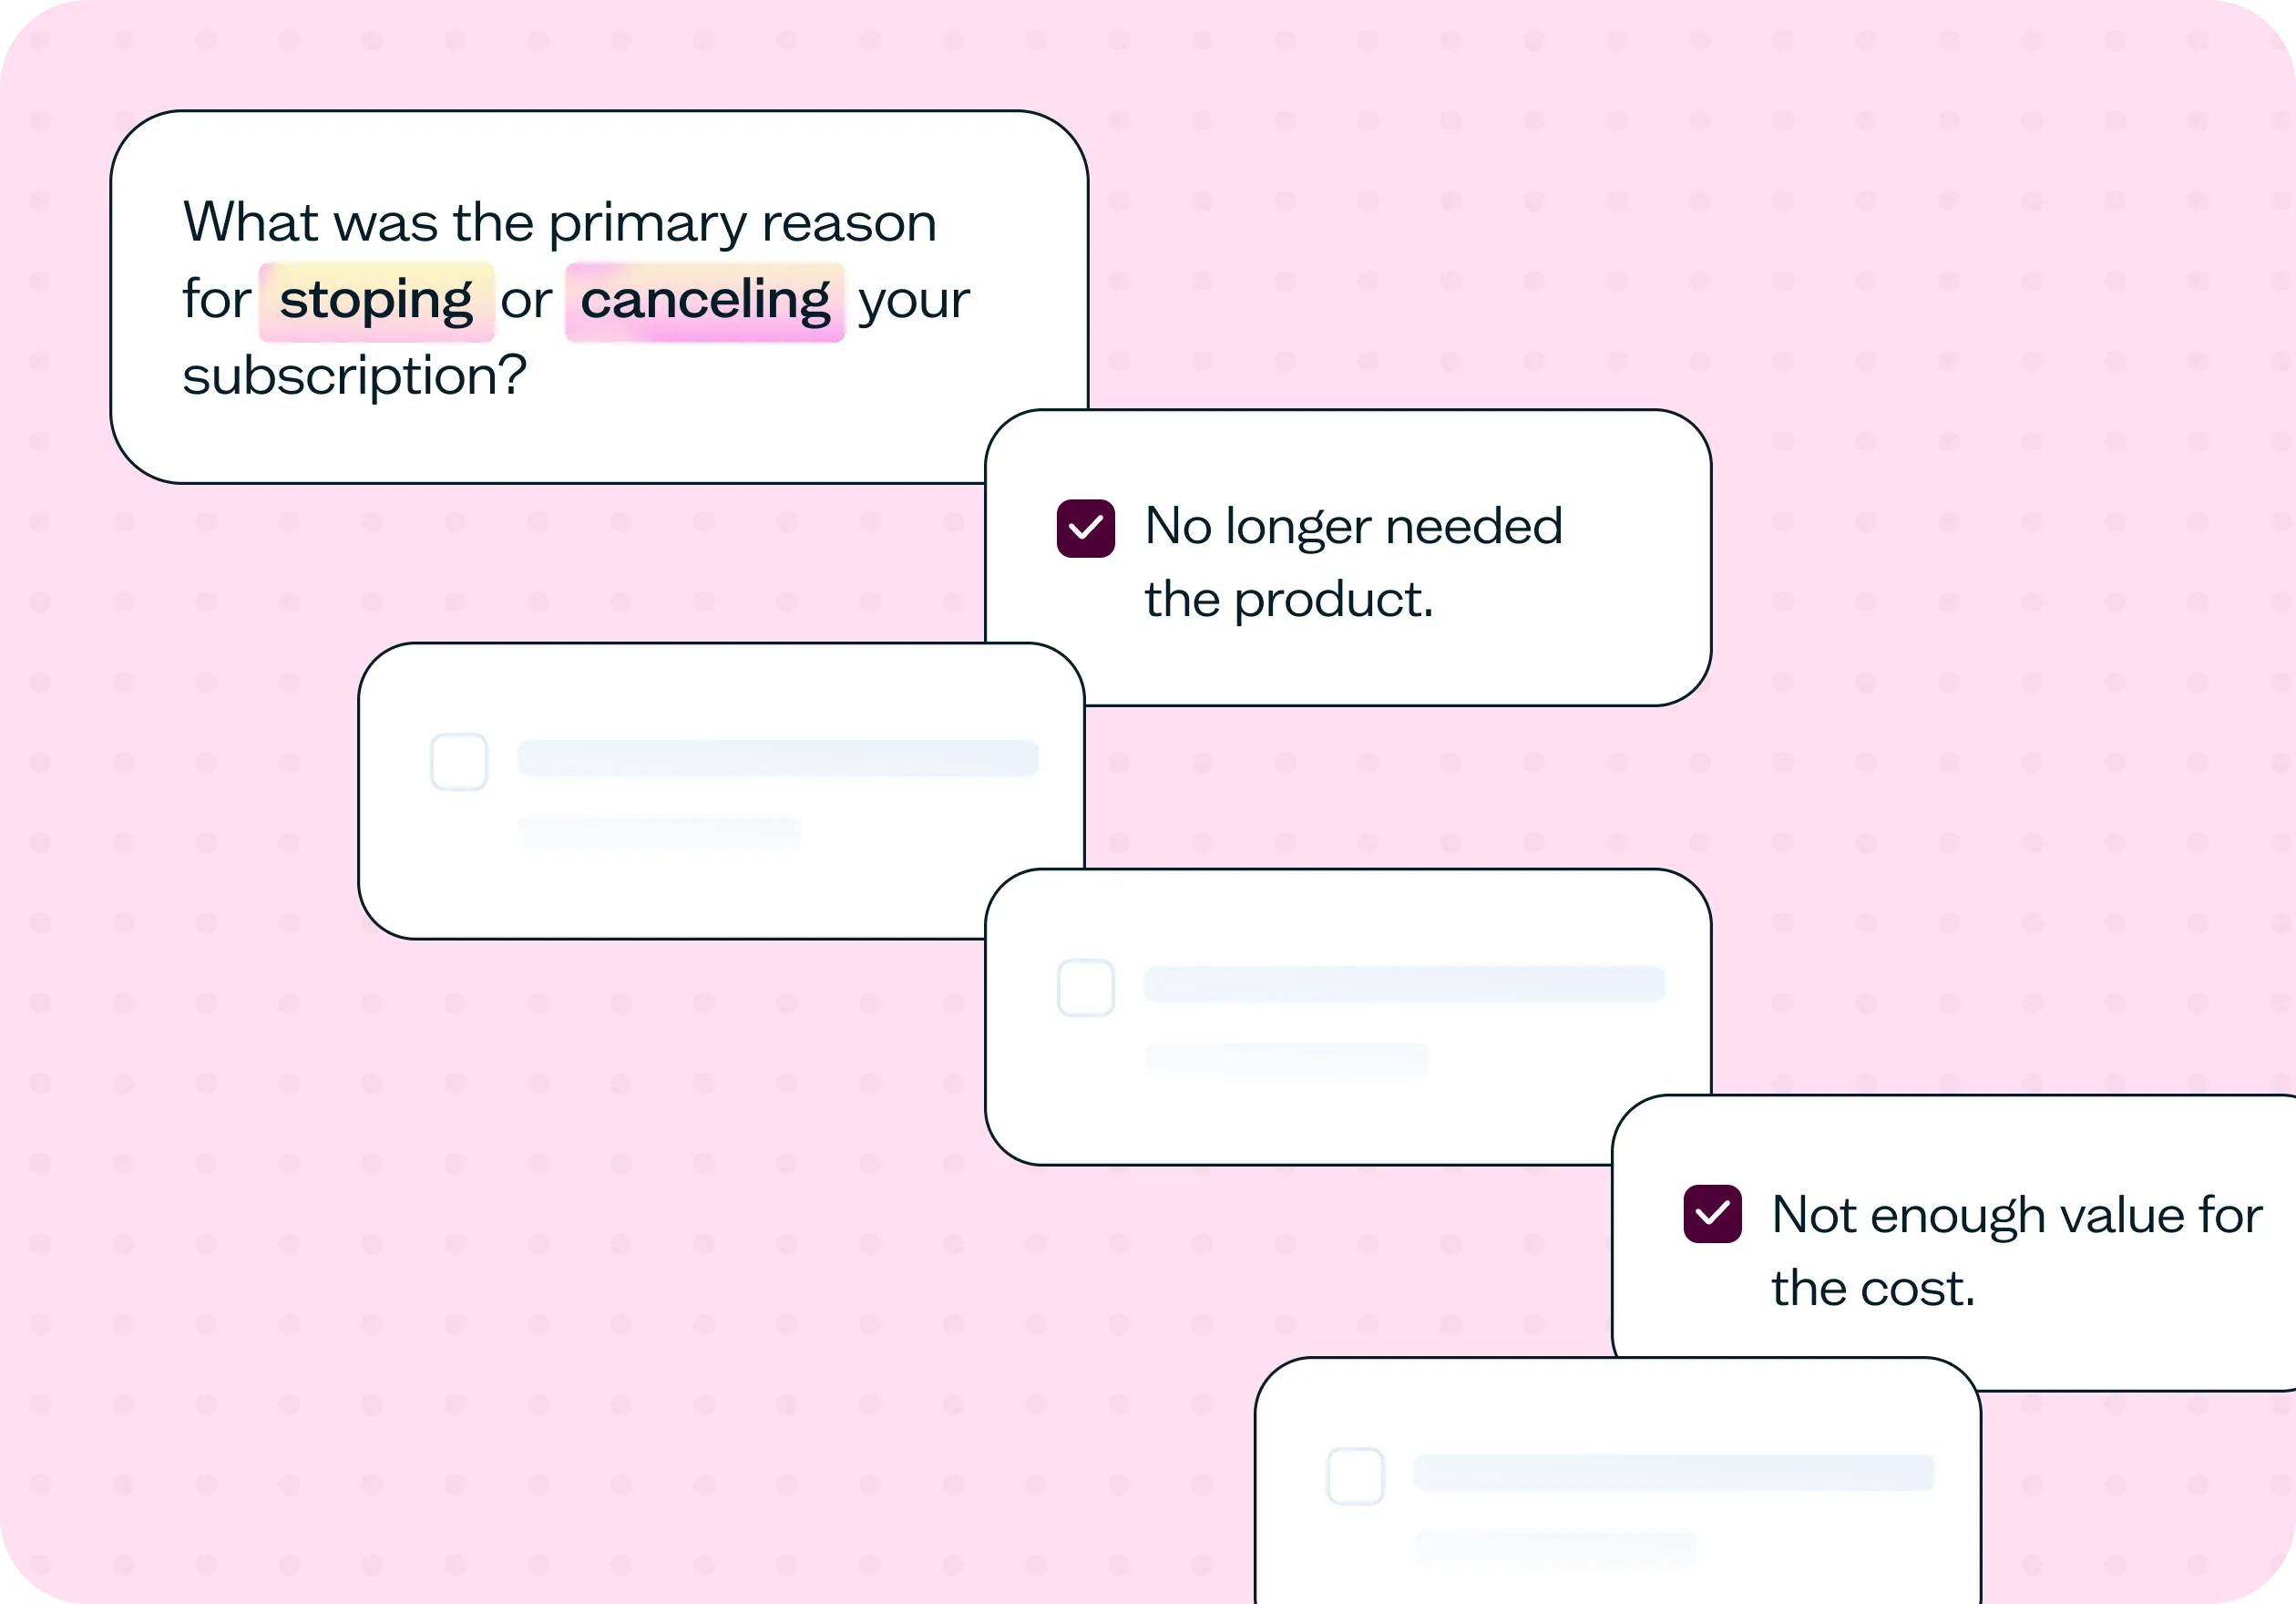
Multiple-choice questions make it easy to identify trends across many respondents – you'll quickly see which reasons cluster together and which are outliers.
Likert scale ratings measure satisfaction and perceived value in a way that's comparable across users and trackable over time. The template includes a rating question on overall value that surfaces how users felt about the product relative to what they paid.
Open-ended questions go deeper. Where multiple-choice captures what, open responses capture why. They surface the emotional drivers, the specific moments of frustration, and the language users reach for when describing their experience – which is often different from the language teams use internally.
Trend analysis across responses reveals recurring patterns: the same complaint appearing across different user segments, the same competitor named repeatedly, the same onboarding friction showing up weeks before users churn.
This approach gives you both the data to quantify the problem and the context to understand it.
How to use this template
Click "Use this template" and log in to your Lyssna account. If you don't have an account yet, start exploring with a free plan.
Customize the survey to your context. The template is built around four research areas – churn investigation, value perception, alternate solutions, and re-engagement. Review the questions and adjust the wording to match your product, your pricing, and the specific cancellation behavior you're investigating.
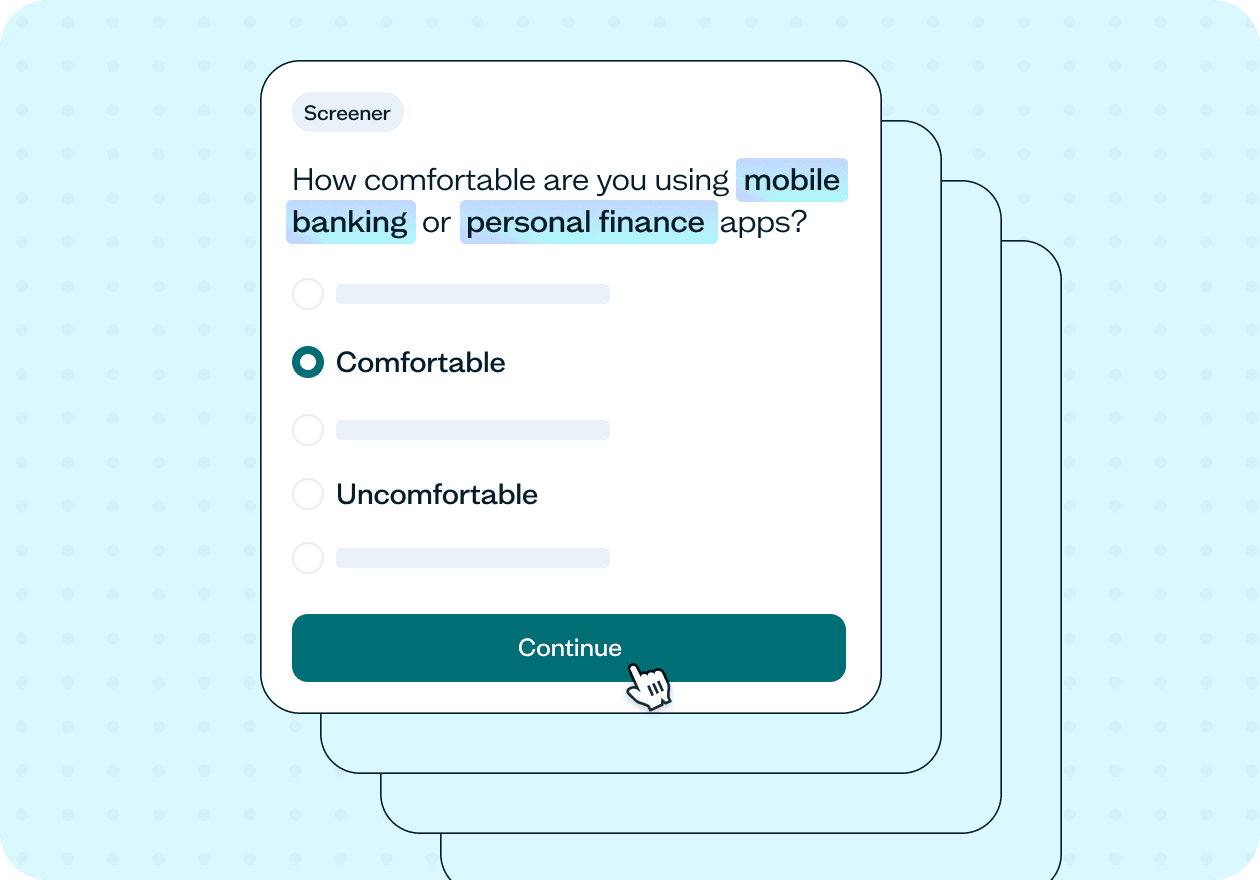
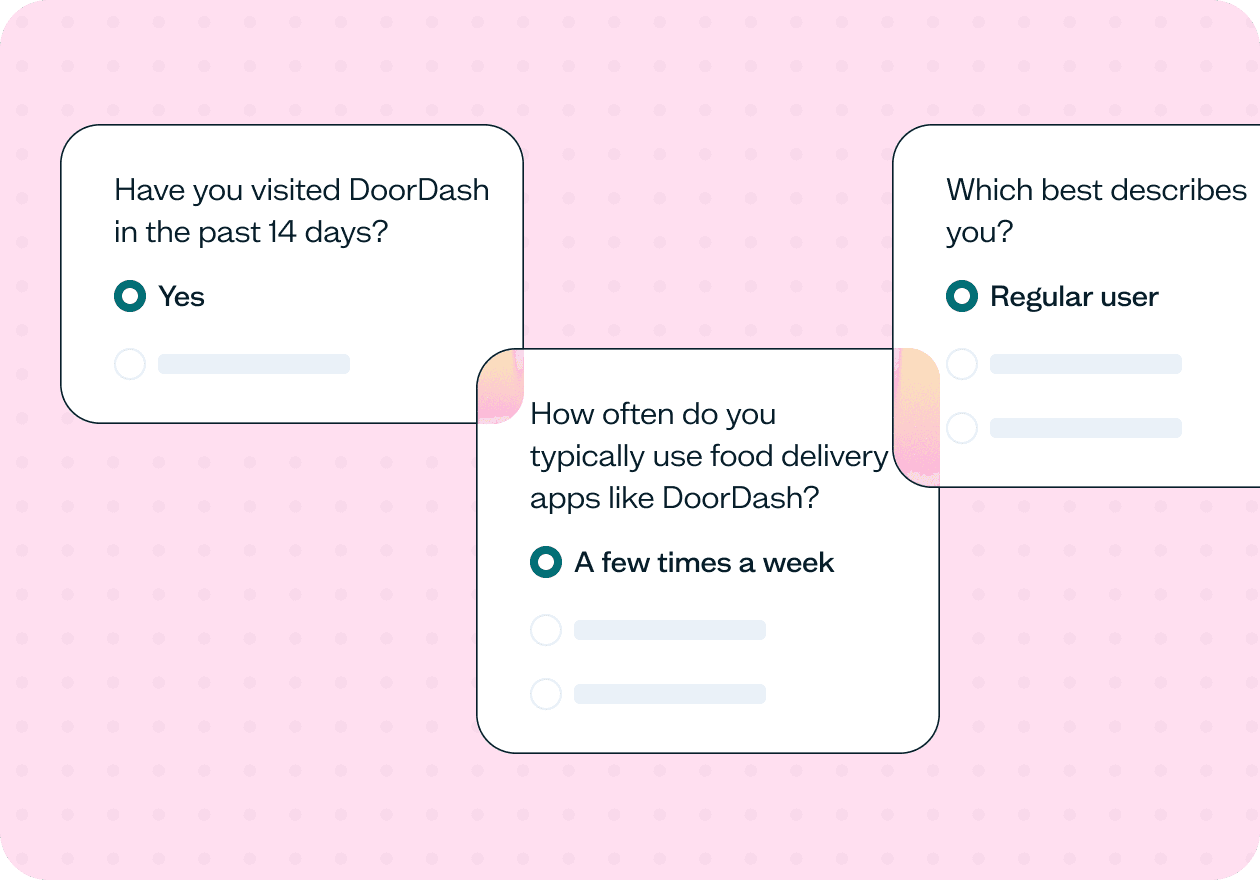
Set up your recruitment. For churn research, you'll want to reach users who have already cancelled or disengaged – so self-recruitment from your own customer list will usually be more targeted than panel recruitment. Use a screener to filter for users who have recently churned.
Preview your test, then save and continue. Check how the survey flows from the participant's perspective before launching.
Set your test live and collect responses. Once results come in, look for patterns across the four sections – recurring reasons, rating distributions, and the language users use in open-ended responses. That's where the most actionable customer insights tend to sit.
When to use this template
This template fits naturally into several points in the product life cycle:
When your churn rate is climbing and you don't have a clear explanation.
After launching new features, to check whether unmet expectations are driving cancellations.
When retention is consistently low across a user segment.
When users are cancelling subscriptions at a specific point in the billing cycle.
Before redesigning core flows or reconsidering pricing, to baseline what's actually driving decisions to leave.
When improving onboarding or activation, and you want to understand what early-stage users expected that they didn't get.
Who this template is for
Whether you're a product manager working to reduce churn, a UX researcher studying user behavior at the point of cancellation, or a growth or customer success team looking to understand why retention drops, this template gives you a structured starting point.
It's also a practical fit for SaaS and subscription businesses tracking lifecycle metrics, and for marketing teams who need to understand where the customer journey breaks down before it's too late to intervene.
FAQs about customer churn surveys
You may also like these templates

Adopting Lyssna got us into the habit of asking our users questions before locking in decisions.

Ron Diorio
VP Business Development & Innovation, at The Economist


Try for free today
Join over 320,000+ marketers, designers, researchers, and product leaders who use Lyssna to make data-driven decisions.
No credit card required