UX research analysis and synthesis
UX research analysis and synthesis are the keys to unlocking your research efforts. Analysis is the process of systematically examining and organizing the data you’ve collected during your research study, whether through user interviews, surveys, usability tests, or other methods. Synthesis takes this further by connecting your findings to discover patterns and deeper meaning that guide your design and product decisions. Together, these processes transform raw data into actionable insights that enhance the user experience of your product or service. In this guide, you’ll gain a deep understanding of how to conduct both UX research analysis and synthesis effectively, and how they work together to create meaningful insights.
UX research guide
Understanding UX research analysis and synthesis
UX research analysis and synthesis work together to transform your research data into actionable insights. Analysis involves organizing, classifying, and examining the data you collect during your research study – like user interviews, surveys, or usability tests. Synthesis takes this organized data and connects it to discover patterns, themes, and deeper meaning.
When you conduct analysis, you’re essentially asking:
What can the data reveal about user needs?
How are users interacting with our product?
What challenges are users facing?
When you synthesize, you’re asking:
Why are these patterns emerging?
What do these findings mean for our users?
How can we connect these insights to drive design decisions?
Both processes tackle qualitative and quantitative data. Whether you’re dealing with numbers or narratives, the aim is the same: to uncover meaningful patterns and themes that shed light on user behavior and product usability, then transform those patterns into insights that guide product teams toward addressing user needs and pain points.
What’s the difference between UX research analysis and UX research synthesis?
When it comes to navigating UX research, terms like analysis and synthesis often get thrown around. But do they really mean the same thing? Before we get into the how-to’s, it's worth understanding the key differences between these terms and how they work together.
Analysis: Breaking down and organizing
At its core, analysis involves sorting and categorizing data. You’re dissecting raw information and organizing it into manageable pieces. This usually involves working with qualitative data (like interview transcripts) and quantitative data (like survey responses or usability metrics).
During analysis, you:
Code and tag your data.
Identify individual findings.
Organize information into categories.
Spot initial patterns and trends.
Synthesis: Connecting and interpreting
Synthesis takes an interpretive route. It’s about looking beyond the individual data points and seeking patterns, connections, and meaningful relationships. This involves spotting themes that connect user experiences, crafting coherent explanations, and building insights. This is the phase where you form groups of notes on an affinity map, merge various themes from multiple interviews, and transform findings into actionable recommendations.
During synthesis, you:
Connect findings across different sources.
Identify deeper themes and patterns.
Create coherent narratives about user behavior.
Transform findings into insights that reveal user motivations.
How they work together
Analysis and synthesis can happen at different stages, but they’re often done at the same time. Through analysis you’ll identify findings – specific observations backed by your data. Through synthesis, you can turn those findings into insights – deeper understandings that reveal why users behave the way they do and what it means for your product decisions.
Think of it this way: analysis helps you see the trees, while synthesis helps you understand the forest.
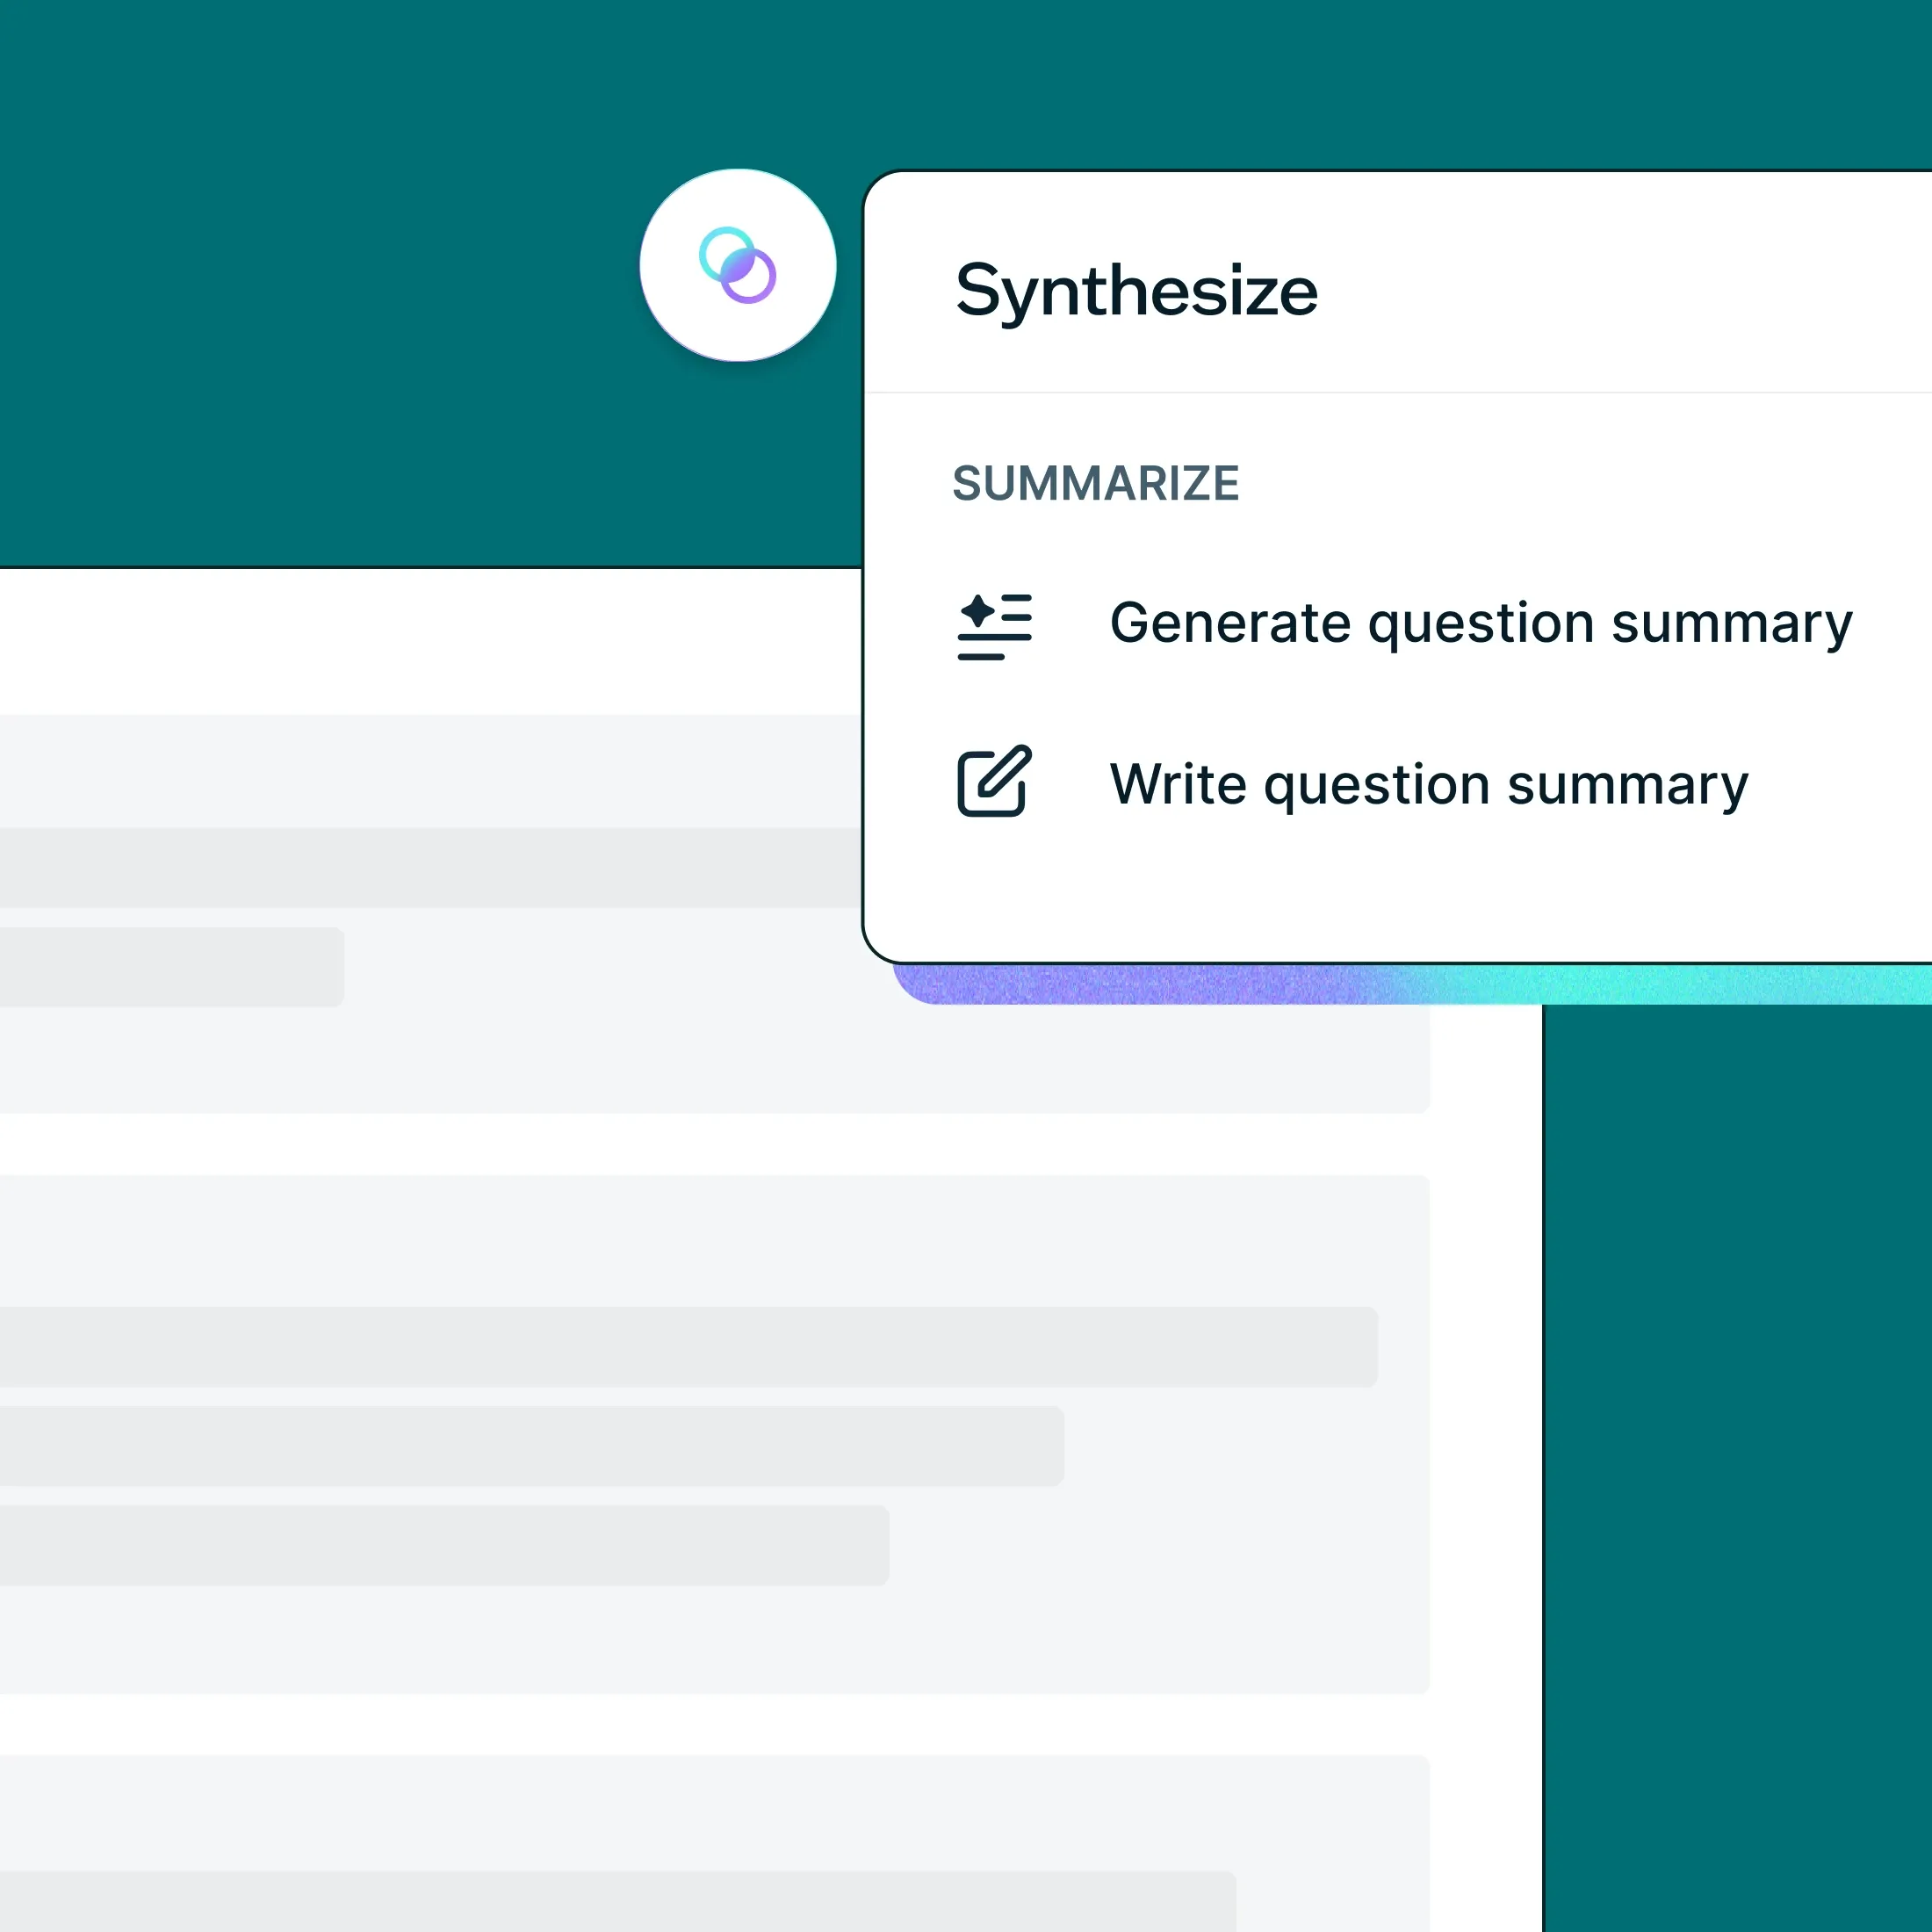
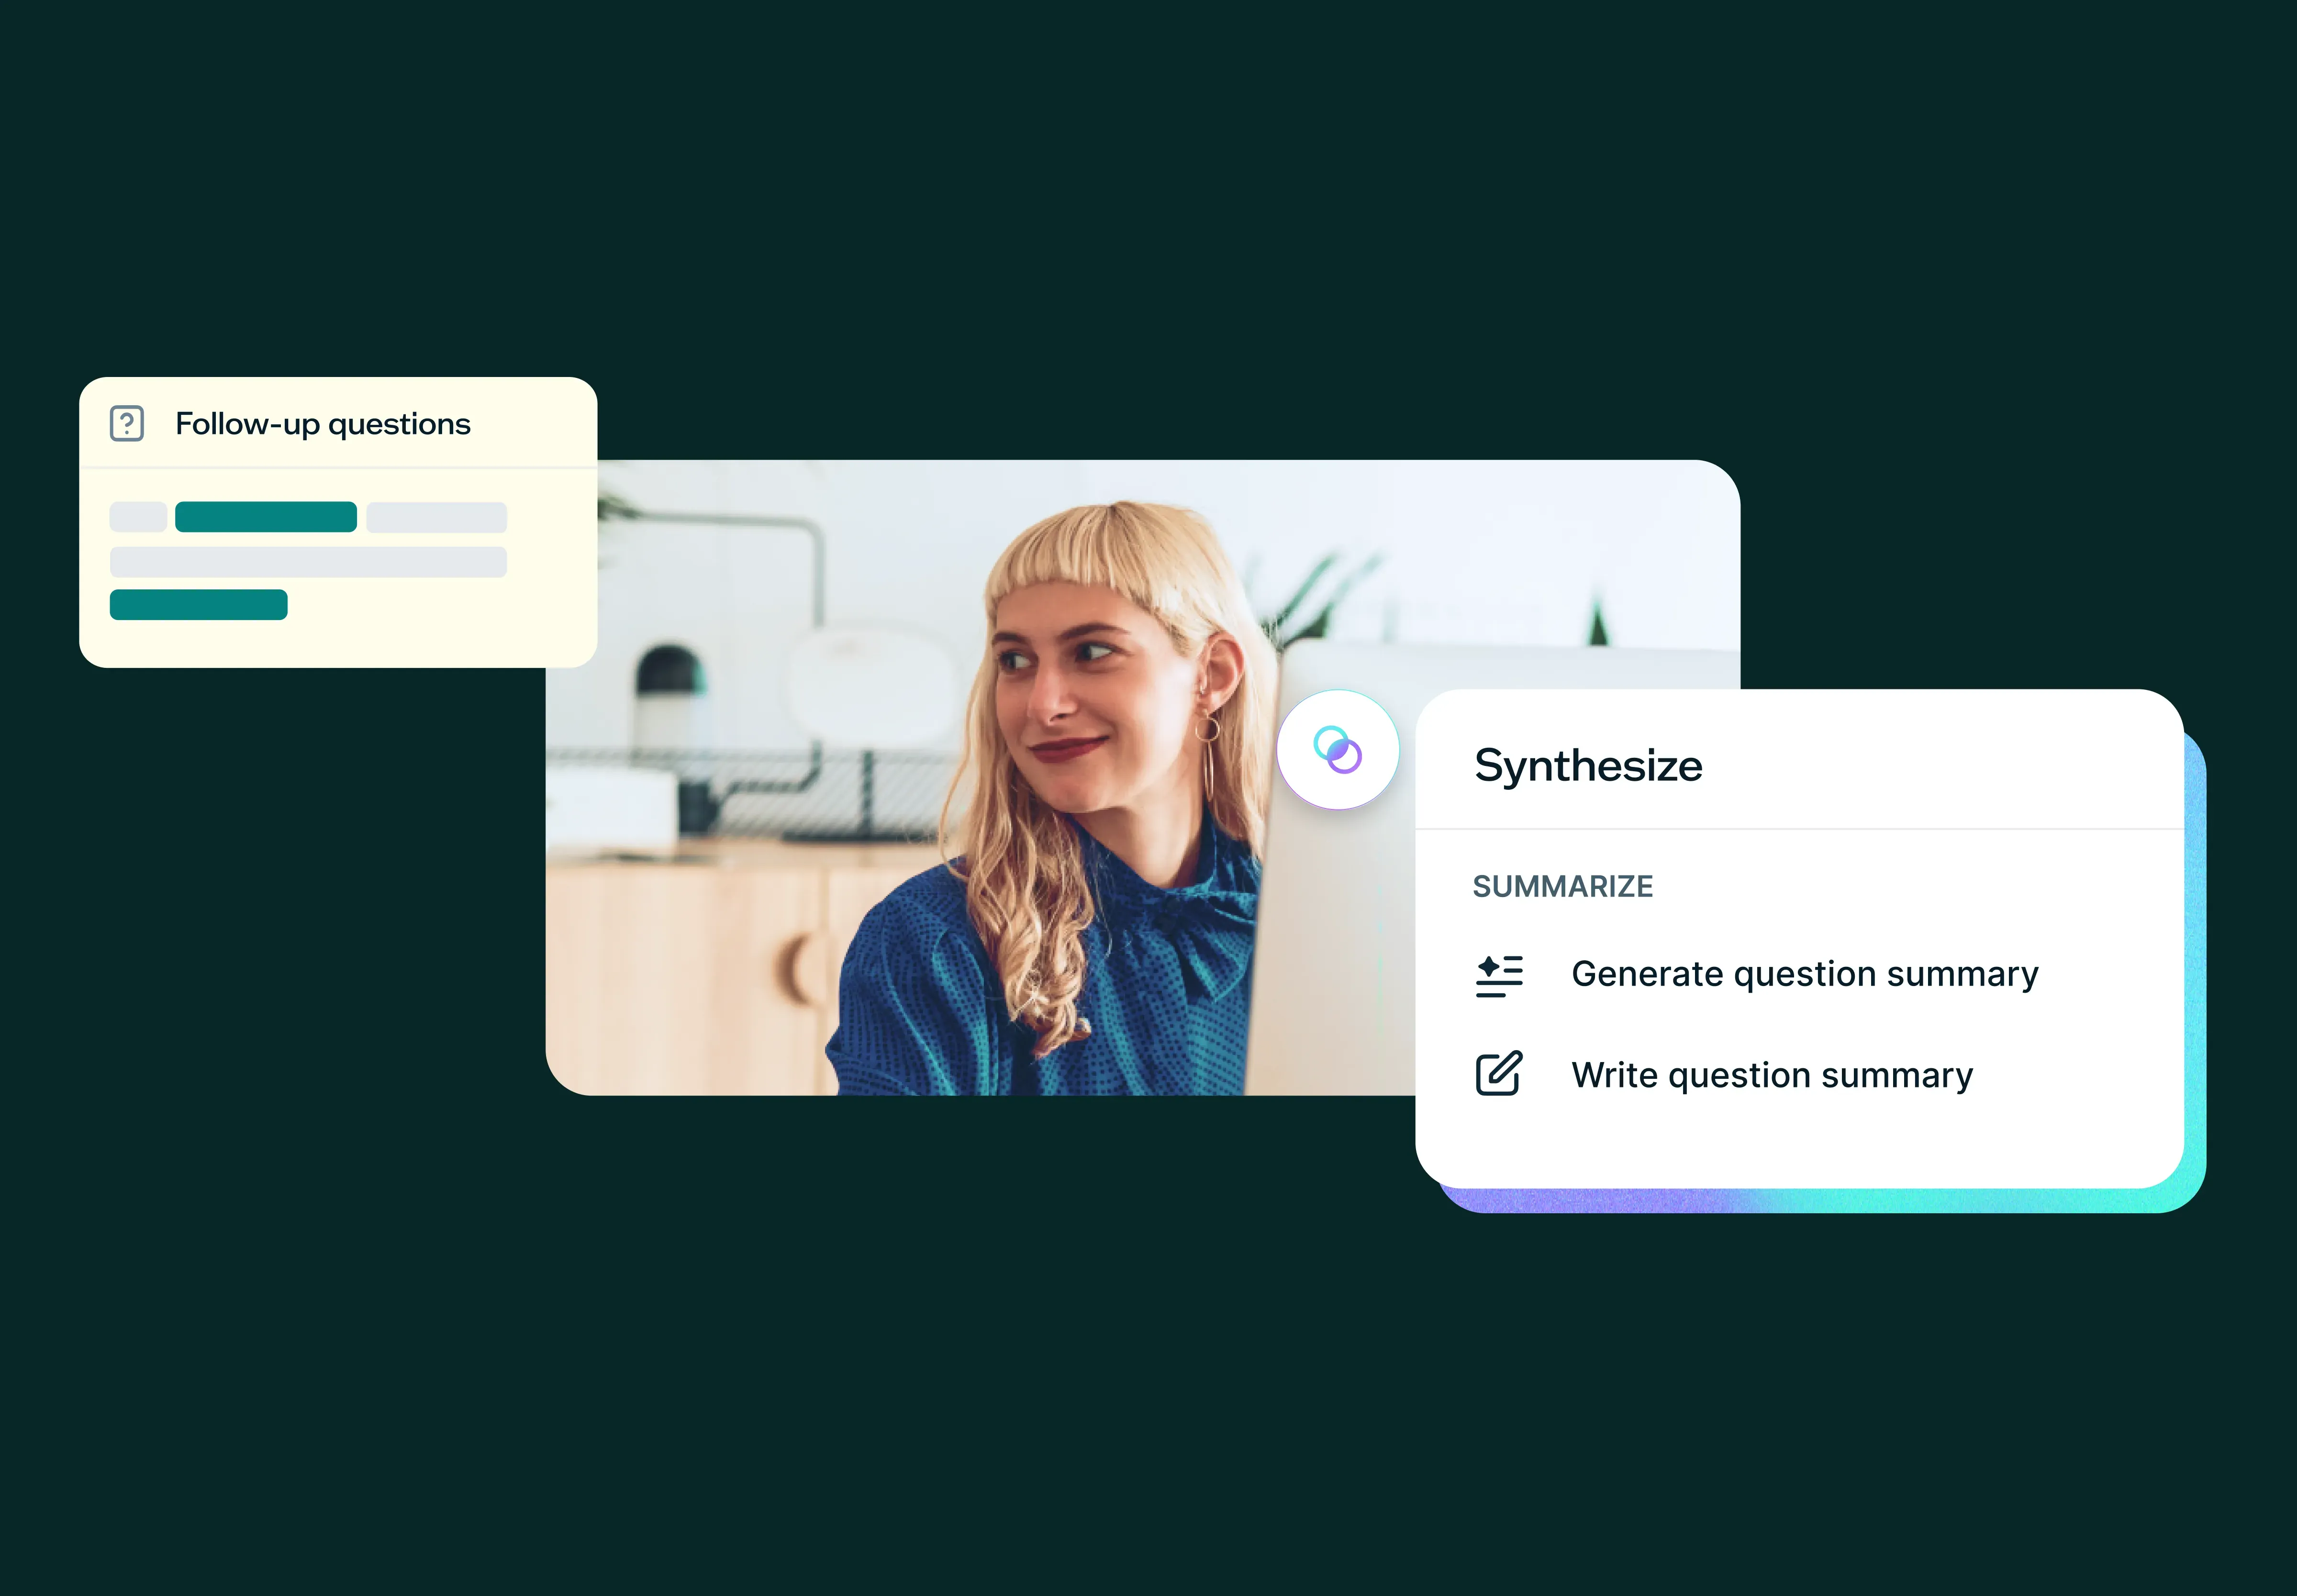
Synthesize with AI
Let Lyssna's AI-powered Synthesize feature summarise key themes from your research data. Sign up today.
When should you conduct UX research analysis and synthesis?
So, when should you begin analyzing and synthesizing all that valuable data you’re gathering? While the obvious answer might be after your study ends, it’s good practice to start analyzing a few steps earlier.
Before researching
Obviously you can’t start analyzing before you begin researching, but you should have clearly defined objectives and research questions. Incorporating this step into your research plan lets you bake analysis into your study from the outset. With a clear vision, you’ll know exactly what to look for when conducting your analysis, which will prevent you from getting lost in a sea of data.
As you gather data
As you start gathering data, conduct on-the-go analysis and note emerging patterns for future synthesis. This practice helps you spot any potential issues early on.
For example, say you’ve conducted a couple of user interviews – by doing some early analysis of your interview transcripts, you might notice that some of your questions are steering the research away from meeting your objectives. You might also start noticing themes emerging that warrant deeper exploration in remaining interviews. Because you’ve caught this early, you'll be able to fix any issues and pursue interesting synthesis opportunities before conducting further interviews.
After data collection
Starting your analysis early can also save you time at the end of the project. But it’s worth noting that most analysis and synthesis will happen at the end of your study. By this point, you should have your raw data, tagged notes, and initial analysis ready – now, it’s time to dive deep into both detailed analysis and comprehensive synthesis to uncover meaningful insights.
How long does UX research analysis and synthesis take?
One of the most common questions we hear is about timing: “How long should I expect to spend on analysis and synthesis?” The answer depends on several factors, but our research study with 300 practitioners provides some helpful benchmarks.
Most synthesis happens quickly
Our survey data revealed that research synthesis typically moves quickly. The most common timeframe is 1–2 days (35.0% of participants), with another 30.3% taking 3–5 days. This means nearly two-thirds of all synthesis work is completed within five days.
Quick synthesis (less than a day) accounts for 21% of participants, while extended synthesis periods (more than 5 days) are less common at just 13.7%.
What affects the timeline?
Several factors can influence how long your analysis and synthesis will take:
Organization size: Larger organizations tend to have longer synthesis periods due to additional stakeholders, formal processes, and complexity.
Research type: Market research and competitive analysis typically require more time due to broader scope and complex datasets.
Your role: Marketing and customer insights professionals often report longer synthesis periods, possibly due to larger sample sizes and more comprehensive analysis requirements.
Data volume: The amount of data you’re working with significantly impacts the timeline.
The most time-consuming tasks
Based on our research, here’s what takes the most time during synthesis:
Reading through responses/data (59.0% of participants).
Organizing findings into a structure (57.3%).
Identifying patterns and themes (55.0%).
Creating presentations/visualizations (49.0%).
Writing summaries (35.0%).
Planning your synthesis timeline
When planning your research project, consider allocating:
1–2 days for straightforward usability tests or small interview studies.
3–5 days for comprehensive user research with multiple methods or large datasets.
5+ days for complex market research or studies involving multiple user segments.
Remember that starting your analysis early – even during data collection – can significantly reduce the time needed at the end of your project.
Quantitative vs qualitative UX research analysis
There are two main types of user research: quantitative research methods and qualitative research methods, each offering unique insights into user behavior and experiences.
Quantitative research deals with objective, measurable data – think completion rates, task durations, and error rates. It’s all about finding concrete answers to questions like “How many users successfully completed a specific action” or “How long did it take them to navigate through a particular feature?” This type of analysis unveils the “what” and “how” of user behavior, shedding light on user actions and interactions within a product or service.
Qualitative research uncovers subjective experiences using words and behaviors. This method captures the depth of user interactions – their feelings, opinions, and thoughts. When analyzing qualitative data, the goal is to identify recurring themes and patterns. This kind of analysis uncovers insights about what resonates with users, how they emotionally connect with an experience, and where they encounter challenges. Bearing in mind the depth of insights means analyzing qualitative data often takes more time compared to quantitative analysis.
Depending on your research objectives and questions, you might opt for one method or find value in combining the two. While they lead to different insights, the ultimate goal remains the same – to understand your users and how to optimize their experience.
Tips for conducting quantitative research analysis and synthesis
In the world of UX research, quantitative analysis deciphers patterns to unveil the "how" and "why" behind user interactions with your product.
Below are some top tips on how to analyze quantitative data.
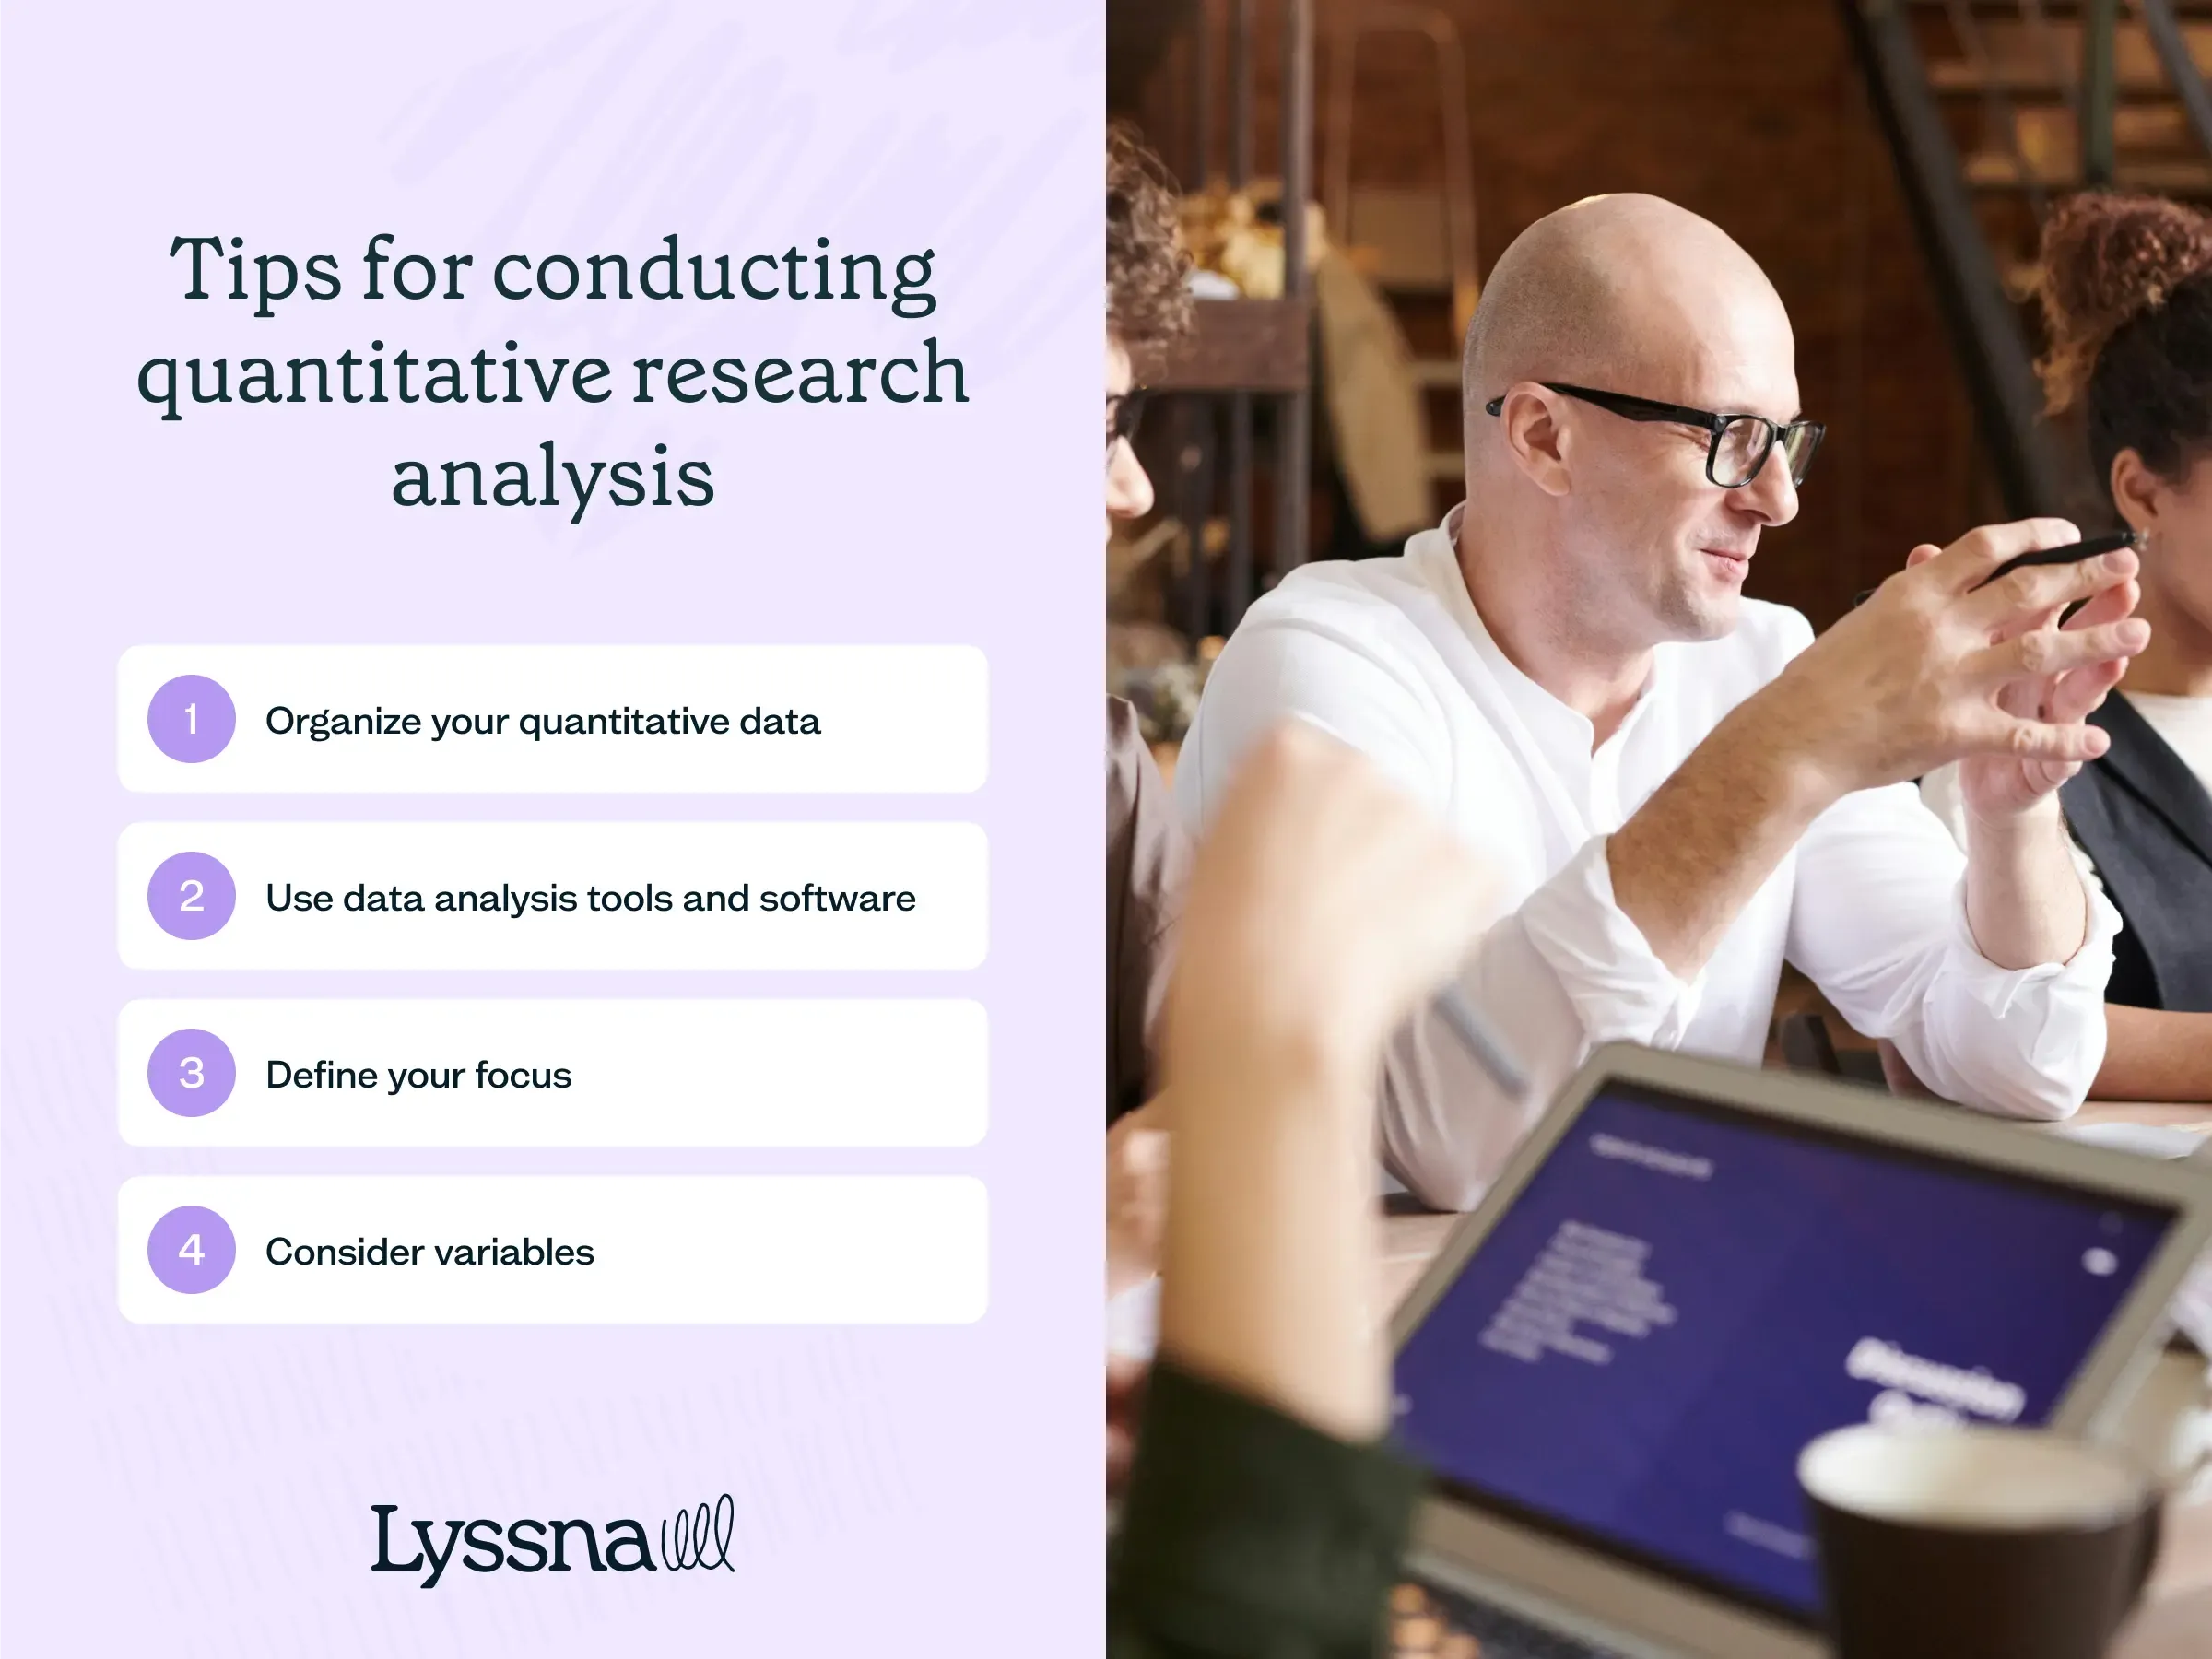
Organize your quantitative data
When you conduct a quantitative study, you'll find yourself with lots of data. You might have the data neatly arranged in a spreadsheet, with each column representing a question and each row containing a participant's responses, or you might need to manually compile data from various sources. Either way, organizing your datasets in a manageable way will help bring structure to your analysis.
Use data analysis tools and software
Once your data is neatly organized, it's time to undertake statistical analysis. Tools like R, Python, SPSS, and Excel can help you crunch the numbers and unearth valuable insights.
Most user research tools will have some analysis functionality built in. In Lyssna, there are various reporting and analysis features available to make this task easy to manage.
Define your focus
Before you start synthesizing, revisit your study's core objectives. What questions are you seeking to answer? For example, you might want to determine how long it takes for a user to complete a task or gauge their satisfaction at different stages of a checkout process. Concentrate on these key questions.
Consider variables
Common variables explored in quantitative analysis include success rates, task completion times, and error rates. You might also assess the overall user experience through survey responses or behavioral data. Demographic and geographic data can also be folded into the analysis, offering insights into user patterns among specific groups.
Tips for conducting qualitative research analysis and synthesis
Qualitative research analysis and synthesis involves carefully reviewing non-numerical data collected from sources like user interviews, focus groups, or diary studies. Our research with 300 practitioners reveals both common approaches and persistent challenges in this process.
Transcribe and tag your qualitative data
If your research involves spoken or written responses from participants, such as interviews, you'll need to transcribe this data. Transcription tools like Rev and Otter can streamline this process. In Lyssna, automated transcripts for user interviews are built in.
You'll also need to consider how you'll tag your data. Some UX research tools, like Dovetail and UserTesting, include transcription and tagging features, which can also help streamline this process. Other popular tagging tools include Miro and Airtable.
Align with your research goals
Before you dive into your analysis, revisit your research objectives. For example, if your goal is to understand user preferences regarding a product’s user interface, focus your analysis on responses relevant to this goal.
Focus areas for qualitative analysis
To make your qualitative analysis more effective, consider the following focus areas as you explore the data:
Patterns and themes: Run a thematic analysis to look for significant patterns and common themes that emerge from users' responses. These recurring elements often hold valuable insights. Our research showed that identifying patterns and themes is time-intensive (cited by 55.0% of practitioners) but crucial for meaningful synthesis.
Surprising findings: Take note of any unexpected findings. Investigate these surprises to uncover their potential implications and significance.
Emotional responses: Pay attention to the contexts in which users express significant emotional responses to questions. Emotions can reveal critical aspects of the user experience.
Feature importance: Determine which product features hold the highest importance for users. Insights into feature prioritization can guide future design decisions.
Cross-segment differences: Our research revealed that practitioners often struggle with conflicting feedback from different user segments. Look for how responses differ across user groups to provide insights into diverse user needs and preferences.
Methods for qualitative analysis and synthesis
Two popular methods can help you extract meaningful insights from qualitative data: content analysis and affinity mapping.
Content analysis
Content analysis can help you uncover valuable patterns in your data and label them for deeper understanding. This method is particularly useful when dealing with lots of text, like interview transcripts.
Here's how to conduct a content analysis:
Define your codes: The first step is to decide on the codes you'll use. You can either define codes based on topics you expect to find or let them emerge naturally as you delve into the data. For example, if you're analyzing customer feedback, codes like "pricing," "usability," and "customer support" might come up.
Assign codes along the way: As you sort through the data, apply these codes. You can do this manually or use a qualitative analysis program to streamline the process. For example, if you're reviewing interview transcripts and a participant shared their frustrations with app navigation, you could apply codes like "usability" and "navigation."
Organize codes into themes: To make sense of the coded data, group related codes under broader categories. For example, codes like "user interface" and "menu layout" might fall under the theme of "app navigation."
Top tip: If multiple team members are involved in coding transcripts, make sure everyone is on the same page. You can test this by having each team member code a small section of data and compare the results. You can then chat through any discrepancies until you reach a consensus on how to apply the codes.
Affinity mapping
Affinity mapping (or affinity diagramming) is a method used to transform a large volume of raw data into structured and actionable insights. This technique is especially useful when analyzing user interviews, surveys, or open-ended responses.
Here's a brief overview of how to create an affinity map:
Collect and segment your data: Gather all the qualitative data you've collected. This could be notes, quotes, or excerpts.
Hold an affinity mapping session: Create physical or digital cards for each data point. During the session, have participants organize the cards into groups (you could use sticky notes or collaboration tools like Miro, InVision, or Figma).
Identify patterns and insights: As you arrange the cards, you'll start to notice connections between different data points. Some cards may cluster together, indicating strong themes or recurring insights. This step helps you identify patterns and relationships that might not have been apparent in the raw data.
Synthesize insights and make recommendations: Once your affinity map is complete, step back and analyze the bigger picture. Synthesize the insights you've uncovered and use them to derive actionable recommendations. These recommendations are grounded in the patterns you've discovered, making them more robust and relevant to your research objectives.

How to analyze and synthesize UX research data: Step-by-step guide
Now that we've covered the different approaches you can take to analyze your UX research data, it's time to dive into the analysis and synthesis process itself. In this section, we'll walk you through each step.
By following these steps, you'll effectively transform raw data into actionable insights. This process not only enhances your understanding of user behavior but also equips you to provide valuable recommendations that contribute to creating more user-centered products and services.
1. Collect and organize your data
Begin by gathering data from the various research methods you've used in your study, like interviews, surveys, or usability tests.
Keep things organized and structured using spreadsheets, note-taking tools, or specialized research platforms. Well-organized data is important for efficient analysis.
2. Revisit your research objectives
Before diving into analysis, revisit your initial research objectives. These objectives will help you stay on course and extract insights that directly address the aims of your study.
For example, say you're conducting research for a collaboration tool aimed at improving remote team productivity. Your initial research objectives might include "Discover the main pain points users experience when working remotely" and "Determine which features are most valuable to remote teams." Reminding yourself of these objectives helps you focus on aspects relevant to your research goals.
3. Analyze your data to uncover findings
Now, it's time to unearth some hidden gems. This involves coding and tagging your data to categorize different types of information. Look for recurring themes, patterns, and trends that span across different data points. This might involve identifying common pain points, user preferences, or behavioral trends.
Whether you're dealing with quantitative or qualitative data, you're on the hunt for patterns and trends. Each finding should be prioritized based on severity and importance, always aligned with your research objectives.
Top tip: Coding data is a useful technique, especially for structuring lengthy text like interview transcripts. It involves tagging relevant insights and observations with concise phrases. For example, if a user mentions difficulties with the checkout process, you could use "Checkout issues" as a code. You can use these codes to categorize and structure your data, making it easier to identify patterns and draw meaningful insights during analysis.
4. Synthesize your findings into insights
With your findings identified through analysis, it's time to synthesize them into meaningful insights. This is where you weave individual findings into a coherent narrative that reveals deeper truths about user behavior, needs, and motivations.
The synthesis process
Synthesis involves connecting findings across different sources and methods to discover patterns and meaning. During synthesis, you:
Connect related findings: Group findings that relate to similar themes or user behaviors.
Look for patterns across data sources: Identify themes that emerge from multiple interviews, surveys, or usability tests.
Challenge assumptions: Use your findings to question existing beliefs about users and their needs.
Create narratives: Build compelling stories that explain user behavior and motivations.
Identify implications: Understand what your findings mean for product decisions.
The progression from findings to insights
Findings and insights are often used interchangeably, but understanding the difference is crucial for effective synthesis:
Findings are specific observations backed by data – they describe what's happening.
Insights reveal deeper truths about user motivations and needs – they explain why it's happening and what it means.
For example:
Finding: "Users abandon the checkout process due to excessive form fields."
Insight: "Users value efficiency over thoroughness during checkout, prioritizing speed and simplicity when they're ready to purchase."
Synthesis techniques
Consider various approaches for synthesizing your data:
Affinity mapping: Group related findings to identify overarching themes.
Storytelling: Create user narratives that connect multiple findings.
Empathy maps: Visualize user thoughts, feelings, and motivations.
Journey mapping: Connect findings across different touchpoints.
Thematic analysis: Identify recurring themes that span multiple data sources.
Your aim is to transform individual findings into insights that reveal user motivations and guide product decisions.
5. Transform insights into actionable recommendations
Your insights hold the power to drive change and improvement. Translate these synthesized insights into actionable recommendations. Align each recommendation with your initial research objectives and outline their potential impact on user experience and business goals. Provide a hierarchy of recommendations based on importance and feasibility.
Top tip: Use user statements, "how might we" questions, and video clips of users to translate complex insights into plain language. If insights are feasible, desirable, and viable, they can initiate new design and marketing initiatives. You might even be asked to weigh in on briefs that will kick off these projects and even help during development to make sure they align with user needs.
Now, your insights are ready to be shared with your stakeholders and your team! User research comes full circle when insights guide decision-making. Share your findings according to your organization's culture, whether through a written report, a presentation, a workshop, or a combination of these approaches.
What tools do I need for UX research analysis and synthesis?
The tools you choose can impact both the efficiency and quality of your analysis and synthesis. Our survey with 300 practitioners conducting research revealed that they use a combination of specialized research tools and general-purpose collaboration platforms. Here’s the current landscape.
Specialized research platforms:
Dovetail: Frequently cited as a dedicated research tool.
NVivo: Popular in academic and enterprise contexts.
Collaboration and AI tools:
Miro: For collaborative affinity mapping and synthesis sessions.
ChatGPT: Integregating AI into synthesis workflows.
Supporting tools: Practitioners also mentioned analytics platforms (Google Analytics, Meta Business Suite), academic tools (Zotero, Google Scholar), transcription solutions (Fathom, Otter), and general collaboration software (Notion, Airtable, Figma).
How to choose the right tools
Your tool selection should depend on the following:
For small teams (1–50 employees):
Focus on tools that offer AI assistance to extend your team's capabilities.
Prioritize platforms that integrate multiple functions (research collection + analysis).
Consider tools with strong collaboration features.
For larger organizations (500+ employees):
Invest in specialized research platforms that can handle complex data management.
Choose tools that support formal processes and stakeholder reporting.
Ensure your tools integrate with existing workflow systems.
Tool integration patterns
Our research shows that most practitioners use multiple tools throughout their analysis and synthesis workflow rather than relying on a single solution. Successful teams often follow this pattern:
Collect data using specialized research platforms.
Process initial findings using AI-assisted tools.
Collaborate on interpretation using visual collaboration platforms.
Document insights using knowledge management systems.
Present findings using presentation software.
Best practices for effective analysis and synthesis
Now that you understand the process and have the right tools, let's explore how to make your analysis and synthesis as effective as possible.
For meaningful analysis
Stay systematic and objective when organizing your data.
Use consistent coding and tagging approaches across your team.
Focus on your research objectives to avoid getting lost in the data.
Document your analysis process so others can follow your reasoning.
For insightful synthesis
Look for connections across different data sources and methods
Challenge your existing assumptions and mental models
Create insights that are memorable and compelling for stakeholders
Ensure your insights connect back to user motivations and needs
Test your insights by asking "So what?" – if you can't answer why an insight matters, dig deeper
Working as a team
If multiple team members are involved in analysis and synthesis, make sure everyone is aligned on your approach. You can test this by having each team member analyze a small section of data and compare results, then discuss any discrepancies until you reach consensus.

Common challenges in UX research synthesis
Even experienced researchers and practitioners can fall into synthesis traps that reduce the impact of their work. Based on our research findings and common patterns, here are the most frequent challenges – and how to avoid them.
1. Conflating findings with insights
The problem: Our research found that 39.3% of practitioners struggle to translate findings into actionable recommendations. Often, this stems from treating findings and insights as the same thing.
What it looks like:
Presenting statements like "Users clicked the wrong button 40% of the time" as insights
Listing observations without explaining their significance
Jumping straight from data to solutions without understanding motivation
How to avoid it:
Use the "So what?" test for every finding
Ask "Why might this be happening?" before moving to recommendations
Focus on user motivations, not just behaviors
Example of the fix:
Finding: "Users clicked the wrong button 40% of the time"
Insight: "Users prioritize speed over accuracy when they're focused on completing a task – they rely on visual cues and spatial memory rather than reading labels"
Recommendation: "Redesign button placement to match users' mental models and increase visual distinction between primary and secondary actions"
2. Analysis paralysis from too much data
The problem: 46.3% of practitioners struggle with synthesizing large volumes of data, and 60.3% cite time-consuming manual work as their biggest frustration.
What it looks like:
Collecting more data than you can reasonably synthesize
Spending excessive time coding every detail instead of focusing on key patterns
Getting lost in the data without clear direction
How to avoid it:
Consider the sample size you need to support your research goals
Define your research objectives clearly before starting synthesis
Set synthesis time limits (remember: 65.3% of synthesis takes 1-5 days)
Use AI assistance for initial data processing and focus your efforts on interpretation
3. Synthesizing in isolation
The problem: While 34.0% of synthesis happens solo, our research shows that small team collaboration (41.0%) often produces better results.
What it looks like:
One person interpreting all the data alone
Missing diverse perspectives on user behavior
Introducing personal bias without team validation
Difficulty getting stakeholder buy-in for insights
How to avoid it:
Include 2–3 team members in synthesis when possible
Validate individual synthesis work with colleagues
Document your reasoning process for team review
4. Focusing on problems without understanding context
The problem: Many practitioners identify what's wrong without understanding the broader user context, leading to solutions that miss the mark.
What it looks like:
Listing usability issues without understanding user goals
Recommending interface changes without considering user workflows
Solving symptoms instead of root causes
Missing emotional and contextual factors that drive behavior
How to avoid it:
Always connect findings back to user goals and motivations
Consider the full user journey, not just the moment you tested
Include contextual questions in your research design
Use empathy mapping and journey mapping during synthesis
5. Overrelying on AI without human validation
The problem: While AI assistance is valuable, human interpretation remains crucial for nuanced understanding.
What it looks like:
Accepting AI-generated themes without validation
Missing nuanced emotional responses that AI can't detect
Losing important context that humans would catch
Generating insights that sound good but lack depth
How to avoid it:
Use AI for initial processing, not final interpretation
Always validate AI findings with human review
Combine AI efficiency with human empathy and context
Remember that AI works best as a synthesis assistant, not a replacement
6. Poor stakeholder communication
The problem: While only 28.0% of participants in our study cited communicating findings as a major frustration, poor communication can make excellent synthesis ineffective.
What it looks like:
Overwhelming stakeholders with too much detail
Using research jargon instead of business language
Presenting findings without clear next steps
Focusing on the research process rather than business impact
How to avoid it:
Lead with business impact, then support with research evidence
Use the communication methods stakeholders prefer (75.3% use presentations)
Create visual summaries alongside detailed findings
Connect every insight to potential business outcomes
Start synthesizing smarter
Ready to transform your research workflow? Try Lyssna's Synthesize feature free and turn data into insights faster.
Navigating UX research analysis and synthesis
In this guide, we've explored the essential processes of UX research analysis and synthesis, critical phases in the journey toward creating user-centered products.
Here are some key takeaways:
Analysis and synthesis work together: Understanding how these processes complement each other is crucial. Analysis helps you organize and examine your data to identify findings, while synthesis connects those findings to uncover deeper patterns and insights that reveal user motivations.
Start early and iterate: If possible, start both analysis and synthesis early, aligning them with your research objectives. This can save you time later and helps you spot potential issues or emerging insights that can inform the rest of your research.
From data to action: The journey from raw data to actionable insights requires both systematic analysis and creative synthesis. Quantitative analysis offers an objective view of user behavior, while qualitative analysis and synthesis together help you understand the "why" behind user behavior and transform findings into compelling insights.
Focus on user impact: Whether you're analyzing completion rates or synthesizing interview themes, always connect your work back to user needs and motivations. The most powerful insights reveal not just what users do, but why they do it and what it means for creating better experiences.
Equipped with this knowledge, you can now confidently navigate the intricate landscape of UX research analysis and synthesis, transforming your research data into insights that drive meaningful product decisions.