21 Sep 2023
|17 min
Quantitative research: Methods, types & real case studies
Explore types of quantitative research, including examples and use cases. Learn how to choose the right method to gather data and drive insights.


Key takeaways
Quantitative research helps you collect objective, measurable data that can be analyzed at scale.
Different methods suit different goals – from descriptive surveys to A/B tests and longitudinal studies.
Choosing the right research design impacts the quality and clarity of your insights.
Quantitative research pairs best with qualitative methods when you need both breadth and depth.
Lyssna offers tools for every stage – from large-scale surveys to fast usability testing – so you can move from data to decisions faster.
If you want to know what your users are doing – how many clicked on a CTA, which path they took, where they dropped off – quantitative usability testing provides you the numbers to back your decisions. It’s the go-to approach when you need reliable, scalable insights into patterns, preferences, and performance.
But numbers alone don’t tell the full story.
Treat numbers as clues, not verdicts. Ten thousand clicks can’t explain a single raised eyebrow you spot in an interview, yet together they reveal cause and effect.
Understanding what people do is powerful – understanding why they do it is transformative. Quantitative research tells you that users abandoned checkout. Qualitative tells you it’s because your form was longer than their lunch break …
Used in tandem, these approaches help teams design smarter, test better, and act faster. In this guide, we’ll focus on the different types of quantitative research, when to use them, and how they fit into a broader mixed-methods strategy.
Turn numbers into insights
Start collecting meaningful user data today with Lyssna. Measure what matters and make data-driven decisions faster.

Understanding quantitative research
Quantitative research is the process by which data is collected and analyzed with the goal of uncovering patterns, relationships, and insights that can be expressed in numerical terms. By quantifying and measuring phenomena, you’re able to draw objective conclusions about a larger group, including better understanding user behaviors, preferences, and market trends.
When a product manager needs to gather information about how users are adopting a new feature, they may look at user engagement, click-through rates, and conversion metrics. By quantifying usage via these usability metrics, they can identify areas for improvement, prioritize changes, and optimize the user experience.
For a UX researcher, quantitative research helps identify broader patterns in user behavior, such as which design elements lead to higher engagement or where users drop off in their journey. Broad data about patterns like these can help create more user-centric designs and improve overall usability.
Quantitative research process
Quantitative research is all about structure – and that starts with a clear, repeatable process. Whether you’re exploring user behavior, validating a feature, or measuring satisfaction over time, following a defined research flow helps ensure your findings are reliable, scalable, and actionable.
Below, we break down the key steps in the process – from defining your goals to applying insights – and highlight how choosing the right research design plays a pivotal role in shaping your results.
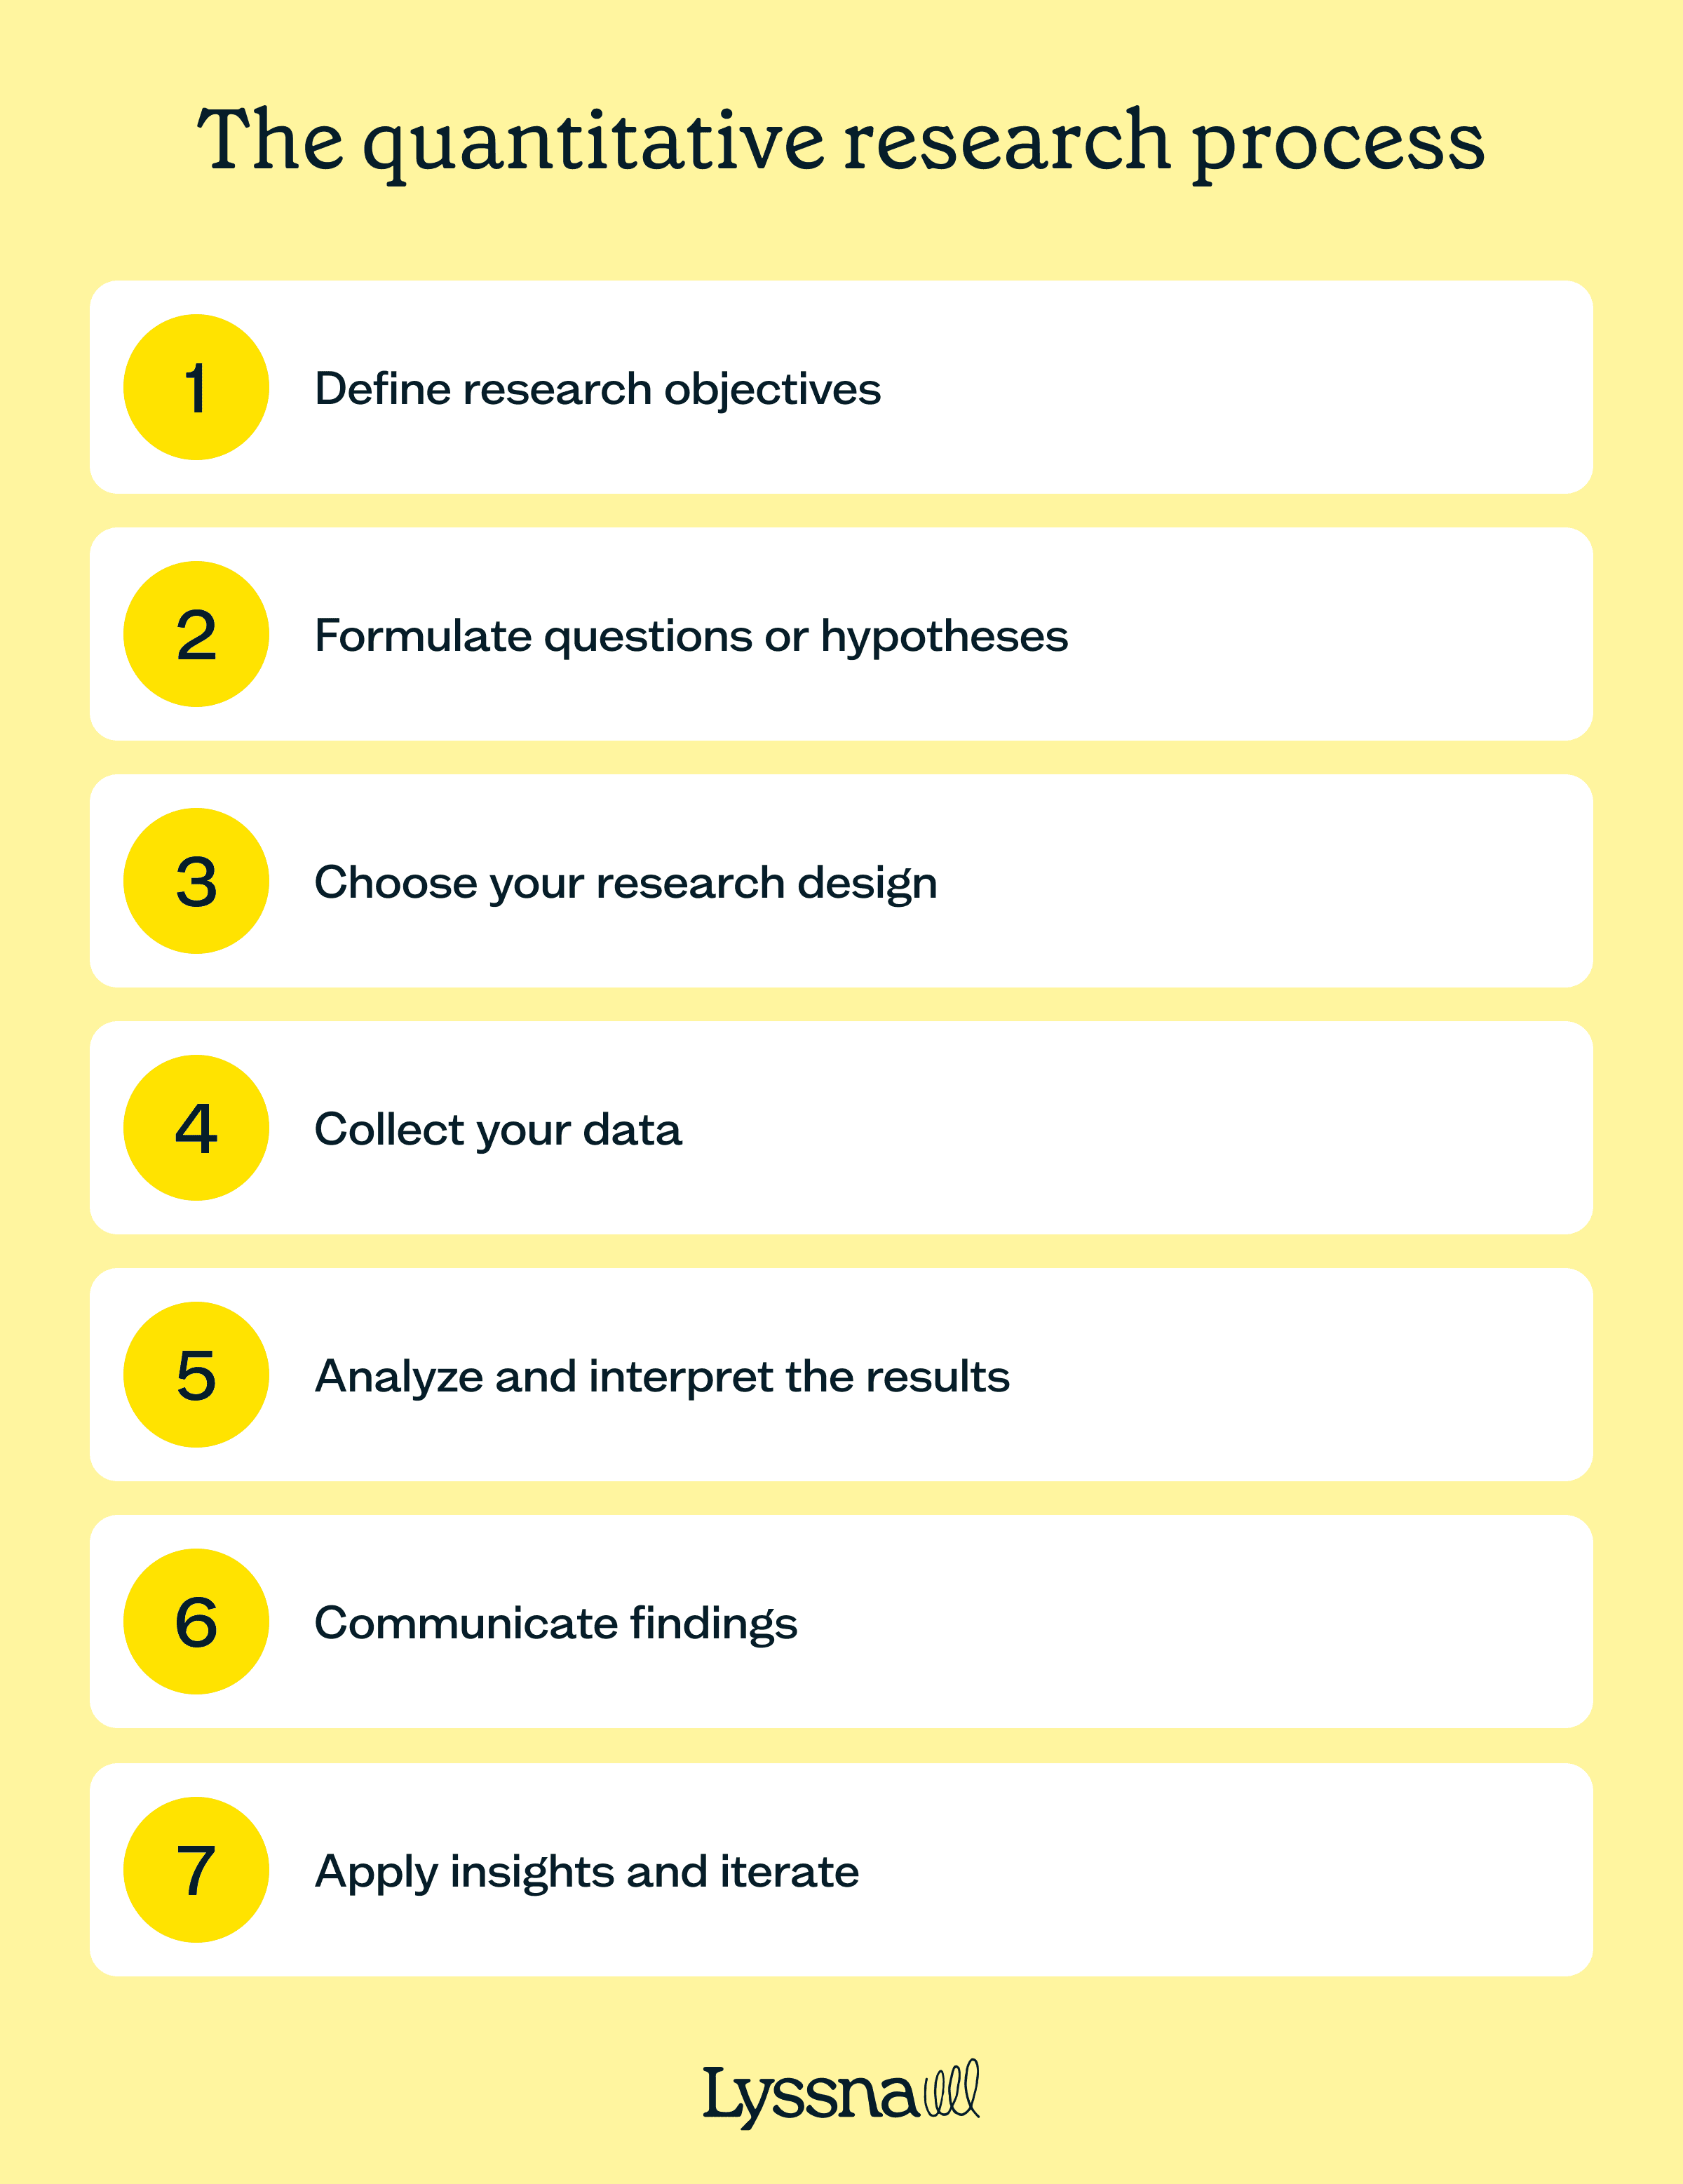
Define your research objectives
Every strong research project starts with a clear “why.” What decision are you trying to support? What problem needs clarity? Whether it’s evaluating a new product feature, tracking engagement, or identifying friction in the user journey, defining your objective upfront gives your research purpose and direction.
Pro tip: Start with a problem statement or a decision you're trying to inform. This keeps your research focused and actionable.
Formulate your key questions or hypotheses
Once you’ve defined your objective, it’s time to turn it into specific questions or hypotheses. These act as the backbone of your research, guiding how you collect data and what you’ll measure.
For example, a hypothesis might be: “Reducing the number of form fields will increase the completion rate of our sign-up flow.” Quantitative research helps you test assumptions like this with statistical confidence.
Choose the right research design
This is where your methodology takes shape. Will you run a survey, analyze clickstream data, or conduct an A/B test? Your research design determines how you'll collect and structure your data, and it should align directly with your objective.
Some designs focus on description (like surveys), others on causation (like experiments). Picking the right one ensures you’re collecting the type of data that matches your goal.
Do a ‘stat-test rehearsal’ first: mock up hypothetical results and ask, Would this change our decision? If the answer is “no,” redesign the study before spending a single research dollar.
(We’ll explore the most common types of quantitative research in the next section.)
Collect your data
Once your design is in place, it’s time to gather data. This might involve recruiting participants, launching a survey, or pulling behavioral data from analytics tools. The key here is consistency – using standardized tools and methods to minimize bias or noise.
Pro tip: A common misconception is that bigger samples always lead to better insights – but quality matters more than quantity. A smaller, well-targeted sample that accurately reflects your target audience will yield more relevant results than a large but poorly matched group. Think carefully about who you're studying: Are they actual users? Potential customers? Segment-specific personas? The closer your sample mirrors the group you're trying to understand, the more confidently you can apply the results.
Analyze and interpret the results
After data collection, the real work begins. Use statistical tools (like R, Python, SPSS, or even Excel) to explore patterns, test hypotheses, and calculate significance. Interpretation is just as important as analysis – this is where numbers become insights.
Look for trends, outliers, and unexpected correlations. And always relate your findings back to your original objectives.
Communicate what you’ve learned
Data doesn’t speak for itself – it needs to be shared in a way that’s clear and relevant to stakeholders. That could mean a report, dashboard, or live presentation. Whatever the format, focus on what matters most: What did you learn? What should we do next?
Pro tip: Frame your findings in terms of impact. How does this insight improve a product, guide a decision, or reduce risk? In our hands-on workshop, we share our top tips on how to effectively present your research to stakeholders.
Apply insights and iterate
Research isn't the end of the process – it’s the beginning of smarter decisions. Apply your findings, test changes, and repeat the process. Quantitative research helps you iterate with confidence, backed by data that scales.
Whether you're refining messaging or overhauling a flow, ongoing testing helps keep your product aligned with real user behavior.
Characteristics of quantitative research
Thanks to its systematic and data-driven nature, quantitative research generates data with consistent qualities. Here are some of the main ones to keep in mind.

Numerical data collection: Quantitative research is interested in numerical data only, including counts, measurements, ratings, and percentages.
Structured instruments: Tools like surveys, questionnaires, experiments, and observations are conducted methodically, utilizing standardized procedures. The idea is to minimize variation so the data is more reliable.
Large sample sizes: A large group of subjects helps make sure the statistical validity and generalizability of the findings. Samples should contain a representative portion of the target population.
Replicability: Other researchers should be able to replicate the study using the same methods and achieve similar results.
Hypothesis testing: Quantitative research often closely follows the scientific method, meaning a hypothesis will be proposed and then tested via the research.
Objectivity: The results should lead to conclusions based on statistical evidence. This makes it appealing to decision-makers.
Quantitative research comes in various forms, each tailored to specific objectives and scenarios.
Below, we explore the various methodologies and approaches you can use to gather valuable insights, so you can feel equipped with the knowledge you need to make informed research decisions.
Types and methods of quantitative research
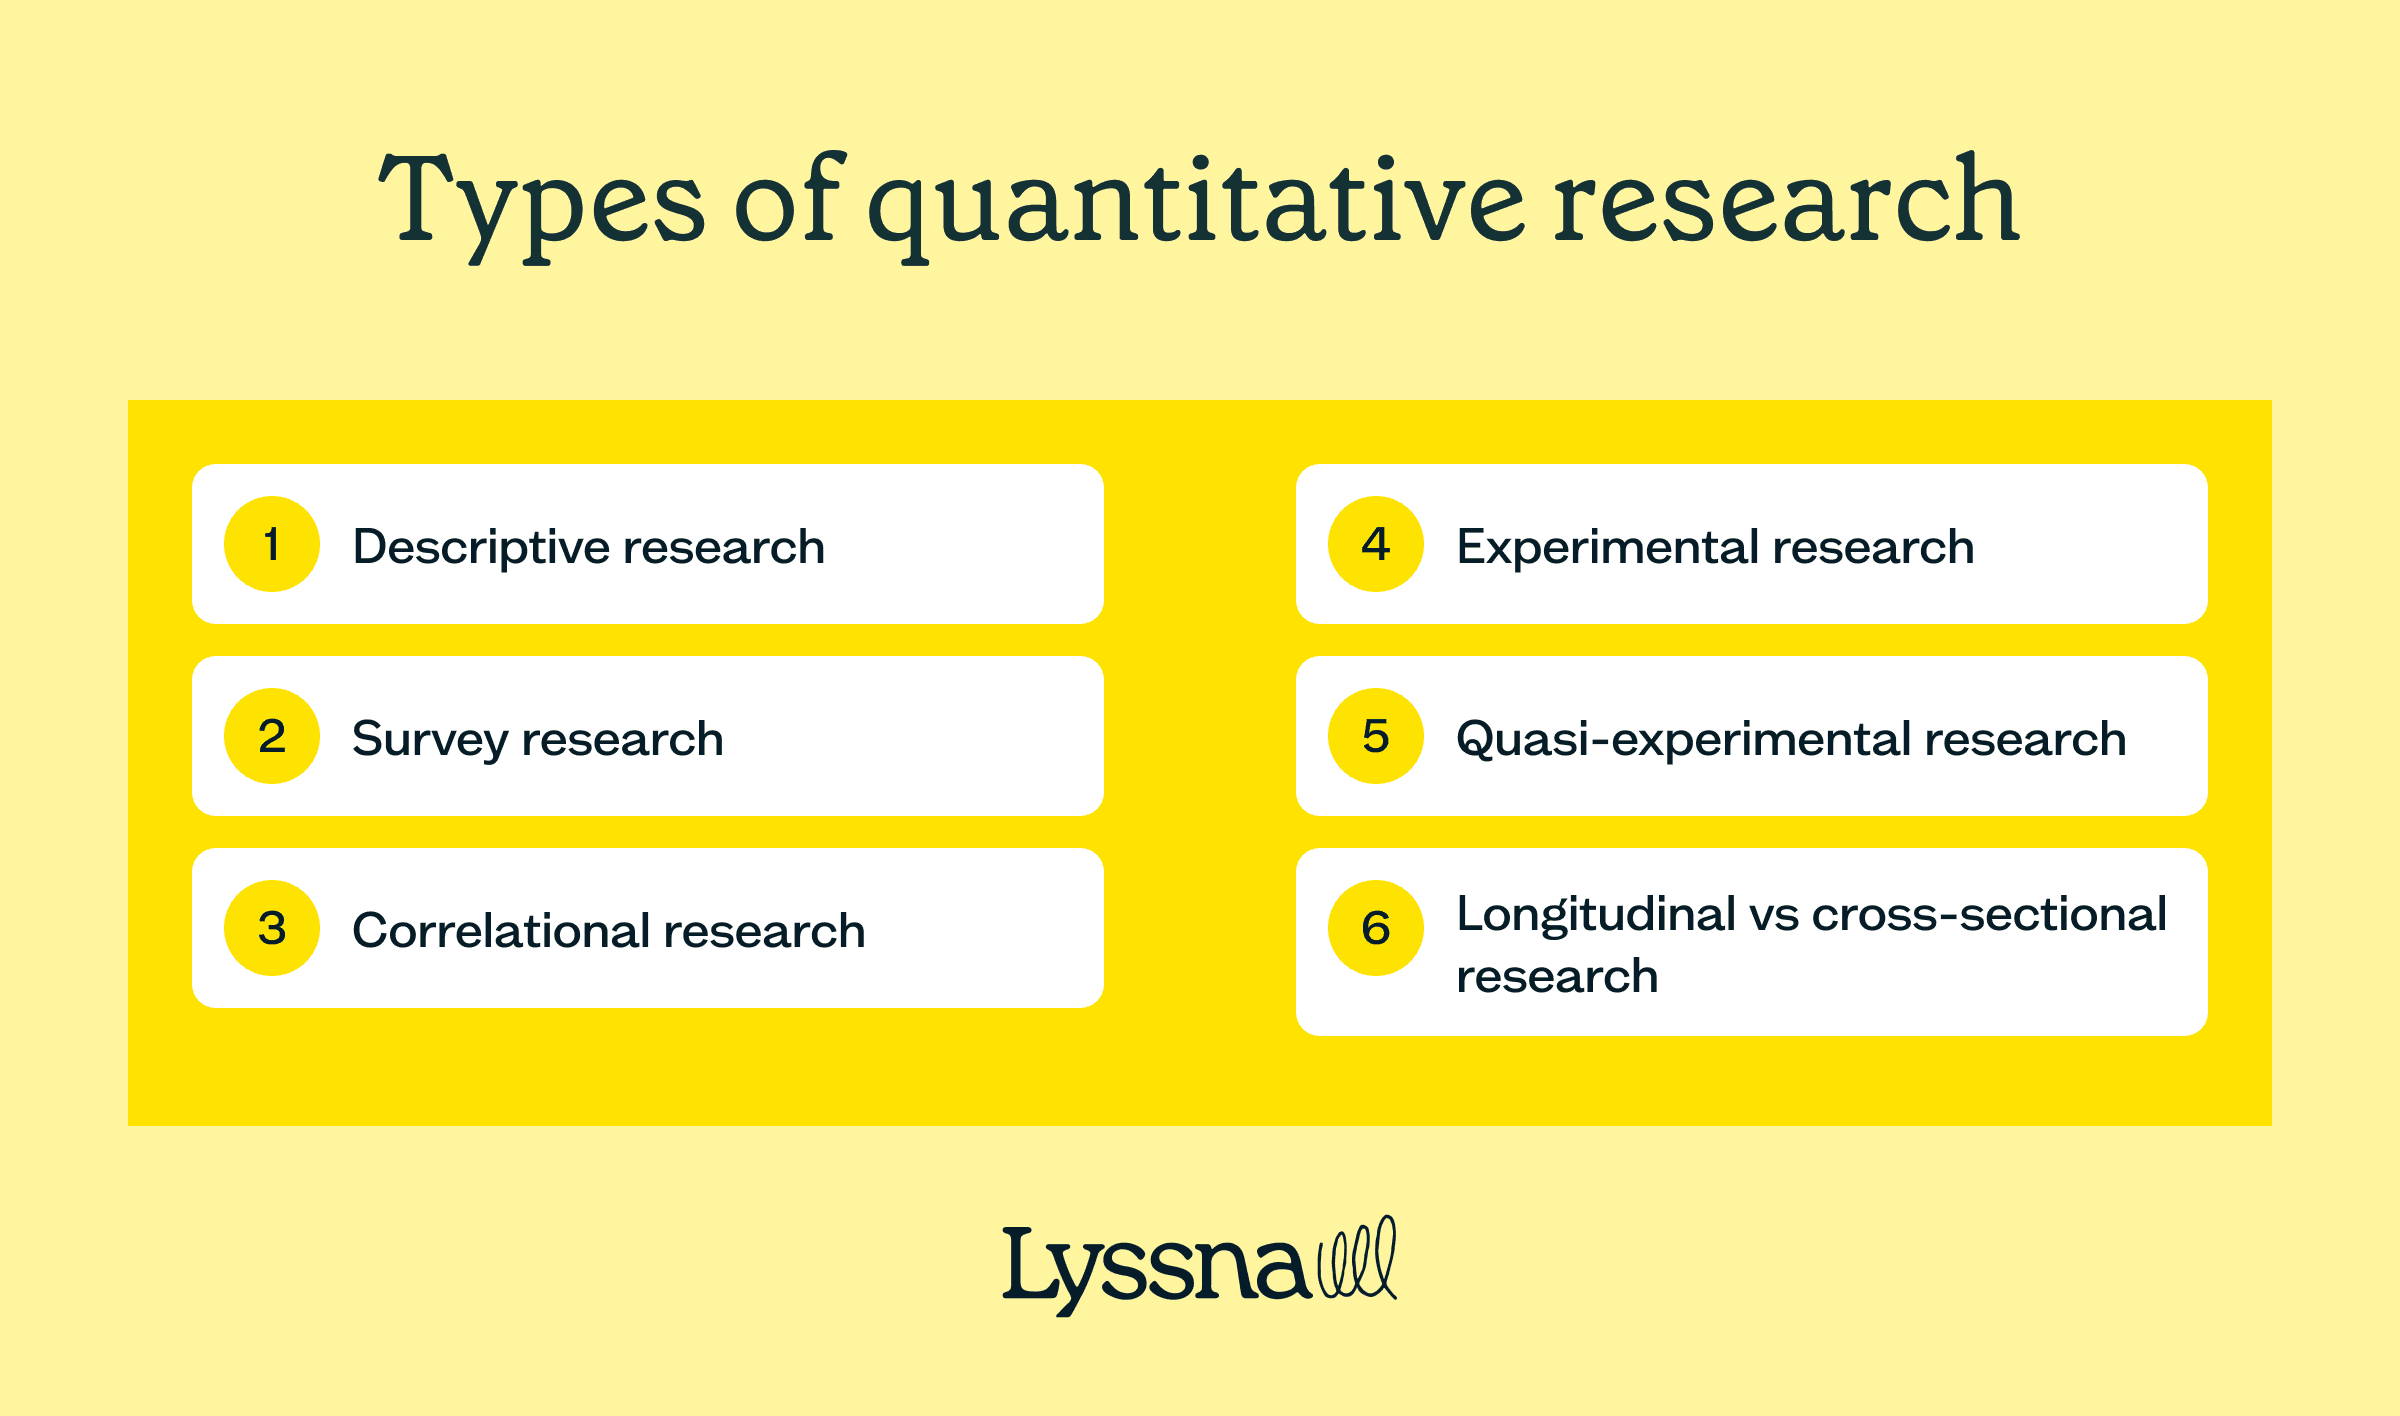
Once you've defined your research objectives and chosen a design, it's time to pick the approach that best fits your goals. Quantitative research comes in a variety of formats – from observational studies to structured experiments – and each is suited to answering different types of questions. Some are descriptive, others are causal. Some take a snapshot in time, while others follow trends over months or years.
Below, we’ll explore the most common types of quantitative research and how to decide which one to use.
Descriptive research
Descriptive research is used to paint a clear picture of what’s happening – without trying to influence it. It answers questions like “What are users doing?” and “How do they behave in a given environment?” without probing into why.
This method is especially useful when you want to observe real-world behavior at scale and summarize patterns across user groups.
Common methods include:
Surveys.
Observational studies.
Analytics or usage data.
Content analysis.
Example: You might use descriptive research to understand how users navigate your website – which pages they land on, how they move between sections, and where they drop off. Tools like heatmaps, interaction logs, and demographic filters help create a snapshot of user behavior as it naturally occurs.
Pro tip: Use descriptive research early in your process to identify patterns and pain points worth investigating further. It helps you spot what’s happening before you decide to explore why it’s happening.

Survey research
Survey research is one of the most widely used methods in quantitative studies – and for good reason. It’s fast, scalable, and ideal for capturing structured feedback from a representative group.
Quantitative surveys are typically made up of closed-ended questions, such as:
Multiple choice.
Likert scales (e.g. rating from 1 to 5).
Single-select or ranking options.
These formats allow you to quickly analyze patterns, compare responses, and quantify user sentiment across large samples.
Looking to get started with survey research? Check out our library of survey templates.
Example: Say you’ve just rolled out a new product feature. You could run a customer survey asking users to rate its ease of use, usefulness, and likelihood to recommend. Segmenting responses by user type or behavior helps uncover trends that raw analytics might miss.
Pro tip: Keep surveys focused and concise – ideally under 10 minutes. And always pilot your questions first to catch confusing wording or response bias before you scale.

Correlational research
Correlational research explores the relationship between two or more variables without manipulating them. It helps you answer questions like, “Are these two things connected – and if so, how strongly?”
It’s ideal when you want to identify potential links or trends across large datasets but can’t (or shouldn’t) intervene directly.
What it tells you:
The direction of the relationship (positive, negative, or none).
The strength of the connection (usually using a correlation coefficient).
Example: Imagine you're exploring whether faster app load times are linked to higher user satisfaction. You collect load time metrics (in seconds) and satisfaction scores (1 to 10) from a large group of users. Correlational analysis might reveal that as load times go down, satisfaction scores tend to go up – suggesting an area worth prioritizing.
Pro tip: I’m sure you’ve heard this one before, but it bears repeating – correlation does not mean causation. Even if two metrics move together, one doesn’t necessarily cause the other – but it could point to something worth investigating further.

Experimental research
Experimental research is designed to establish cause and effect. By manipulating one variable and observing its impact on another, you can draw clearer conclusions about what actually causes a change in user behavior.
This method involves:
An independent variable (what you change).
A dependent variable (what you measure).
A control group or condition for comparison.
Ideally, random assignment to reduce bias.
Example: A product team wants to test whether changing a CTA button color increases click-throughs. They randomly split users into two groups: one sees a red button, the other sees a green one. By comparing click rates between the two, they can determine if the color itself impacts user behavior.
This kind of randomized test – commonly known as A/B testing – is one of the most practical forms of experimental research in marketing, product, and UX work.
Pro tip: Always test one variable at a time. Changing multiple things at once may give you results, but you won’t know what actually caused them!

Quasi-experimental research
Quasi-experimental research looks a lot like experimental research – but with one key difference: there’s no full control over how participants are assigned to groups. This might be due to practical, ethical, or logistical reasons.
You’re still testing how an independent variable affects a dependent one, but without the ability to randomly assign participants or fully isolate conditions.
When to use it:
When randomization isn’t ethical or possible.
When studying real-world behavior in natural environments.
When comparing existing groups (e.g. users before vs after a product update).
Example: A marketing team wants to compare how two ad formats perform. One group of users saw a carousel ad, the other saw a static image – but users weren’t randomly assigned. Instead, the ad format varied by region. While not a true experiment, the team can still analyze click-through and conversion data across both groups to draw directional insights.
Pro tip: Use quasi-experimental research when you need real-world feedback fast – just be mindful of the limitations in your conclusions. Correlation doesn’t always equal causation (yes, that one again!), but patterns can still inform smart decisions.

Longitudinal vs cross-sectional research
Both longitudinal and cross-sectional studies help you understand user behavior – but they take different approaches to time.
Cross-sectional studies
Take a snapshot at a single point in time.
Are fast, efficient, and cost-effective.
Are best for getting a broad view of behavior or attitudes right now.
Longitudinal studies
Track the same users over a longer period.
Reveal how behavior, attitudes, or usage change over time.
Are more resource-intensive but yield rich insights into trends and retention.
Example: If you want to know how users are interacting with your app this week, a cross-sectional survey can show usage rates, most-used features, and demographics. But if you want to understand how attitudes shift after a major redesign – or what drives long-term retention – a longitudinal study is the better fit.
Pro tip: Longitudinal and cross-sectional studies don’t have to live in silos. Combining them – or pairing them with qualitative follow-ups – can give you both the big picture and the deeper story behind it.

Secondary qualitative research methods
Not every insight needs to start with a new study. Secondary qualitative research taps into existing sources – from Reddit threads to academic papers – to uncover user sentiment, behavior, and emerging patterns.
It’s especially useful in early-stage projects or when time and resources are limited, helping you ground your work in what’s already known.
When to use it:
You’re exploring a new area and need a baseline understanding.
You have limited time or budget.
You want to supplement primary research with broader context.
You’re looking for longitudinal patterns or cross-cultural comparisons.
Here are some of the most valuable places to look.
Publicly available content
Forums and communities: Reddit, Stack Overflow, Discord, Slack communities, niche industry spaces.
Social media threads: LinkedIn comments, Twitter/X discussions, Facebook groups.
User-generated reviews: App store feedback, G2/Capterra reviews, blog comments.
Published research & reports
Academic libraries: Peer-reviewed studies on user behavior, design psychology, etc.
Industry whitepapers: Competitive benchmarks, UX best practices, or tech adoption trends.
Government or NGO data: Large-scale surveys or behavioral studies from trusted institutions.
Internal company sources
Support transcripts: Customer complaints, questions, and frustrations.
Sales call recordings/notes: Prospect objections, competitive comparisons, and feature requests.
Past surveys or NPS results: Open-ended responses often hide gold.
Internal research repositories: Transcripts, decks, or interview notes from past studies.
In short: Secondary research helps you build on what’s already known – so you can spend more time solving, and less time rediscovering.
When to use quantitative research (with examples + templates)
Quantitative research is ideal when you need clarity at scale – whether you’re testing usability, validating assumptions, or comparing user preferences. Below are a few common product and UX challenges, paired with research methods and ready-to-use Lyssna templates to help you take action quickly.
1. You need to test how easily users find information on your site
Method: Tree testing.
Template: Improve IA with tree testing template.
Why it works: See where users struggle, which categories are confusing, and what structure leads to faster findability – all backed by measurable success rates.
2. You want to validate a new home page design
Method: Five second testing.
Template: Get first impressions of your landing page template.
Why it works: Unlock information about whether your home page quickly conveys your brand message and engages users within the critical first five seconds.
3. You’re optimizing a product onboarding flow
Method: First click testing.
Template: Website UI intuitiveness template.
Why it works: Find out where users instinctively click first and whether your intended flow aligns with their expectations.
4. You want to measure users’ perception of trust or clarity
Method: Five second testing.
Template: Landing page clarity test template.
Why it works: Capture first impressions and test whether users grasp your value prop in just five seconds – before bounce rates tell the story.
5. You need fast feedback on microcopy, icons, or UI elements
Method: Survey or preference test.
Template: Website user experience template.
Why it works: Quantify user preferences around language, iconography, or button placement – especially useful for smaller iterative updates.
“Surveys, preference tests, and quick usability checks keep the feedback loop open without slowing down the process. The key is making research a habit rather than a hurdle.” - UX researcher, Jib Kiattinant
The pros and cons of quantitative research
Quantitative research is a powerful way to gather scalable, statistically sound insights – but like any method, it’s not without trade-offs. Here’s a quick look at the strengths and limitations to keep in mind when deciding how to approach your next study.
Pros | Cons |
|---|---|
Provides clear, objective, and measurable data | Doesn’t explain why users behave the way they do |
Enables analysis at scale across large user groups | Can miss edge cases or nuanced experiences |
Great for spotting trends and patterns | Relies on well-structured questions – poor design can skew results |
Easier to communicate findings via charts and metrics | May overlook emotional, contextual, or situational factors |
Helps validate assumptions and guide product decisions | Requires statistical tools and data literacy |
Make your metrics matter
Choosing the right type of quantitative research isn’t just about numbers – it’s about making better, faster decisions with confidence. Whether you’re validating a new feature, tracking behavior at scale, or optimizing performance, the method you choose shapes what you discover.
Lyssna gives you the tools to run high-impact, low-lift quantitative studies – from first-click tests and five-second impressions to scalable surveys. And when you're ready to go deeper, you can layer in qualitative insights to complete the picture.
Start measuring what matters
Sign up for Lyssna now and access powerful testing tools that transform user behavior into clear product decisions.

You may also like these articles


Try for free today
Join over 320,000+ marketers, designers, researchers, and product leaders who use Lyssna to make data-driven decisions.
No credit card required