13 Jun 2025
|37 min
From chaos to clarity: How teams synthesize research in 2025
Discover how 300 researchers synthesize data in 2025 – including AI adoption rates, time-saving methods, and strategies to streamline your process.

Why research analysis and synthesis matters now
Ever stared at mountains of research data feeling completely overwhelmed, wondering if there’s a better way to extract meaning from the chaos? You’re not alone – this is a common challenge faced by professionals across research, design, product, and marketing roles (and really anyone else who finds themselves conducting research).
Synthesis – the process of transforming raw data into actionable insights that drive decisions – remains one of the most challenging parts of the research process. While courses and resources often focus on data collection methods, the critical skill of synthesis receives less attention, leaving many teams to develop their own approaches through trial and error.
So we set out to better understand how research synthesis actually happens across teams and organizations. Not just the idealized process described in best practice guides, but the messy, real-world practice, with all its constraints and compromises. We wanted to know: Who’s doing synthesis work? How long does it really take? What methods are working? Where are people getting stuck? And how are emerging tools and technologies changing the game?
Our goal isn’t just academic curiosity. By mapping the actual synthesis landscape and identifying key challenges, we hope to provide practical insights that can help teams improve their processes and get greater value from their research efforts.
Editor’s note: We fully appreciate the irony of conducting research about research synthesis … The meta nature of this project wasn’t lost on us as we faced our own challenges organizing and making sense of all this data. We’ve literally lived the very process we’re reporting on!
How we conducted this research
This report presents findings from a global survey conducted in May 2025. We recruited 300 professionals using the Lyssna research panel. To make sure we got a diverse global perspective, we placed three separate orders:
Order 1: Global participants with no location targeting (100 participants).
Order 2: Participants from North America (100 participants).
Order 3: Participants from Australia and Europe (100 participants).
When recruiting our participants, we used demographic filters to target practitioners across multiple roles including UX/UI designers, product managers, UX researchers, and marketers – recognizing that synthesis work happens across various disciplines.
We’ll dig into these demographics in more detail in the next section.
To make sure participants had relevant experience with research synthesis, we also added a screener question: “How frequently have you personally synthesized research findings (e.g. user interviews, usability tests, survey data) in the past 12 months?”
The distribution of synthesis frequency across our qualified participants reveals an active research community, and suggests our participants are well-positioned to provide informed perspectives on current synthesis practices.
A quick note on language
While we use “synthesis” as our primary term throughout this report, we recognize that the process our participants describe at times includes both analysis (breaking down data into manageable components) and synthesis (combining insights into themes, patterns, and recommendations). This reflects the reality that these processes are closely intertwined in practice, and our findings cover both aspects of making sense of research data.
Throughout this report, we use the term People Who Do Research (PWDR) to describe professionals who conduct research even though it’s not their main title. This includes designers, product managers, and marketers who do research as just one part of their job.
What we wanted to find out
In conducting this study, we aimed to:
Map the current landscape: Identify the most common methods, tools, and approaches researchers and PWDR are using to synthesize insights from qualitative and quantitative data.
Uncover key challenges: Document the primary pain points and bottlenecks in the research synthesis process that prevent teams from getting maximum value from their research.
Measure time investment: Understand how much time teams typically dedicate to synthesis and which specific activities use the most resources.
Identify success factors: Find out what separates effective synthesis processes from ineffective ones based on real experiences.
Explore tool usage and AI adoption: Assess how specialized tools, general-purpose software, and emerging AI technologies are being used for research synthesis tasks.
The big picture: What we discovered
Our research revealed several important insights about the current state of research synthesis:
Democratization is real: Our sample shows that design, product, and marketing professionals are actively involved in research synthesis work. While this distribution may partly reflect our recruitment strategy, it supports the trend that research extends beyond dedicated research roles.
Synthesis happens quickly: The majority of research synthesis (65.3%) is completed in 1–5 days, with only 13.7% of projects taking more than 5 days.
Manual work remains the top frustration: 60.3% of participants cite time-consuming manual work as their biggest synthesis pain point.
AI adoption is substantial, but human collaboration remains essential: 54.7% of participants now use AI assistance in their analysis and synthesis process, virtually tied with team debriefs/collaborative sessions (55.0%) as the most common approach. This suggests AI is being integrated into collaborative workflows rather than replacing the human elements of synthesis.
Confidence is high despite challenges: Despite numerous frustrations, 97% of participants express at least moderate confidence in their synthesis process, with 52% feeling “very confident.”
In this report we’ll dig deeper into each of these areas, exploring the tools, methods, challenges, and opportunities shaping the practice of research synthesis in 2025.
Whether you’re leading research at a large organization or occasionally running user tests as part of your product design work, we hope you’ll find insights that help make your synthesis process more effective and efficient.
Who’s doing research synthesis (and what they’re working with)
Who’s making sense of all that research data? And what are they synthesizing?
Our survey of 300 practitioners reveals an evolving field where research synthesis happens across different teams. From designers and product managers to dedicated researchers, professionals across disciplines are rolling up their sleeves to transform raw feedback into actionable insights.
Let’s explore who’s doing this work, what they’re working with, and how synthesis practices vary across different organizational contexts.
Research synthesis isn’t just for researchers anymore
When looking at who’s doing the work of research synthesis, Designers dominate our sample, making up 40.3% (121 participants) of our audience. Product Managers/Owners represent the second-largest group at 19.7% (59 participants), followed by Marketing/Customer Insights professionals at 15.3% (46 participants).
Dedicated UX Researchers account for only 8.3% (25 participants) of our sample, which may come as a surprise to some. When combined with Research/Design Leads or Managers, research-focused roles make up just 14% (42 participants).
Some of the roles in the "Other" category include independent consultants and freelancers, and CRO, business, and data analysts.
This distribution may be a direct result of our recruitment approach, but it also suggests that research synthesis has become increasingly decentralized, with design professionals often taking the lead in making sense of user data.
It’s a reflection of how user research has become integrated into the broader product development process rather than remaining isolated within dedicated research teams.
A young field: Experience levels across participants
Our survey captured a relatively young professional base in terms of research experience. The vast majority of participants (75.6%) have between 1–7 years of experience, with 1–3 years (38.3%) and 4–7 years (37.3%) being almost equally represented.
Senior practitioners with 8+ years of experience make up only 16.7% of the total participants, with the most experienced researchers (13+ years) being the smallest significant group at just 6% (18 participants). Those with less than 1 year of experience represent 7.7% of the sample.
This distribution might reflect the current state of the industry, with many practitioners having entered the field in recent years as the importance of user research has gained more recognition across organizations.
From startups to enterprises: The organizational landscape
Our participants represent organizations of all sizes, providing a picture into how synthesis practices vary across different contexts. Medium-sized organizations (51–500 employees) represent the largest segment at 31.0% (93 participants), while small organizations (1–50 employees) make up the second-largest group at 26.7% (80 participants).
Larger enterprises are also well-represented, with organizations having 501–5,000 employees accounting for 16% (48 participants) and those with 5,000+ employees making up 13.7% (41 participants) of our sample. Independent consultants and freelancers represent 12.7% (38 participants) of participants.
This balanced representation allows us to understand synthesis practices across the spectrum – from solo practitioners and small teams to large enterprise environments with complex research operations.
Research synthesis is global
Our survey reached research practitioners across 34 countries, giving us a truly global perspective on synthesis practices. The United States (79 participants), United Kingdom (20), Canada (27), Netherlands (27), India (27), and Germany (14) had the strongest representation, but we also heard from practitioners in countries like Australia, Denmark, France, and Italy.
This geographic diversity highlights how research synthesis is a global practice, with professionals across continents working to make sense of user data and drive better product decisions.
While methods and tools may vary, the fundamental challenges and approaches to synthesis show strong consistency across regions.
What’s being synthesized
Understanding what types of research data are being synthesized helps us paint a clearer picture of how organizations are gathering and making sense of user feedback.
Our survey reveals that practitioners are working with a diverse range of research methods, with some clear patterns emerging in terms of popularity and prevalence.
Most common research types
Direct user interaction methods dominate the landscape of research synthesis. Usability tests and user interviews share the top spot, with both selected by 69.7% of participants (209 each). This strong emphasis on methods that provide direct user feedback suggests that organizations continue to value in-depth, contextual insights.
Customer surveys are also widely synthesized (62.7% of participants), creating a trio of core research methods that form the basis of most synthesis work.
The customer feedback ecosystem
Beyond the top three methods, we see a second tier of research types that are synthesized by more than half of our participants: analytics data (56.7%), competitive analysis (55.7%), and customer feedback/support tickets (55.0%).
This group represents a more diverse blend of methodologies, incorporating both quantitative data (analytics) and ongoing customer communications (support tickets). The strong showing of competitive analysis is particularly interesting, highlighting how organizations are generating insights not just about their own users, but about the broader market landscape.
Less common but valuable methods
Market research appears in a middle position at 40.3%, but this finding should be interpreted within the context of our sample demographics. With Marketing/Customer Insights professionals representing only 15.3% of our sample, the relatively lower prevalence of market research synthesis may partially reflect this underrepresentation rather than indicating less value placed on this method across the industry as a whole.
Field studies and ethnographic research are the least common (14.7%), which also likely relates to our sample. With dedicated UX researchers making up only 8.3% of participants, and these methods typically requiring specialized training that researchers are more likely to have, our findings might underrepresent their actual usage in the broader industry.
Despite their relatively lower prevalence in our data, both market research and field studies provide valuable perspectives that complement more commonly reported methods. The former offers broader market understanding, while the latter provides rich contextual insights that are difficult to capture through other approaches.
A multi-method approach
Our data suggests that most practitioners don’t rely on a single research method – instead, they conduct and synthesize findings across multiple types of research. This multi-method approach has several advantages:
Triangulation: Confirming findings across different methods increases confidence in insights.
Complementary strengths: Different methods reveal different aspects of user behavior and needs.
Broader coverage: Combining methods helps reach different user segments and use cases.
Richer context: Qualitative methods provide the “why” behind quantitative patterns.
The challenge, of course, is effectively synthesizing across these diverse data sources – a theme we’ll explore in later sections on synthesis methods and pain points.
Research synthesis across different types of organizations
The types of research being synthesized vary somewhat by organization size and type. Our data indicates that larger organizations (5,000+ employees) are more likely to incorporate a wider range of research methods, including more resource-intensive approaches like field studies.
Similarly, the role composition within organizations influences which types of research are prioritized. We found that design-led organizations tend to focus more heavily on usability tests and user interviews, while marketing-heavy teams more frequently synthesize survey data and competitive analysis.
This suggests that effective synthesis practices must be adaptable to different organizational contexts and priorities. As teams evolve and organizations grow, the mix of research being analyzed and synthesized is likely to change as well, requiring flexible approaches and tools that can scale with changing needs.
How long research synthesis actually takes
How much time does it take to transform raw research data into actionable insights? Perhaps not surprisingly, our survey reveals that most teams are working within tight timeframes.
Let’s explore the typical synthesis durations, what factors influence these timelines, and which specific activities create bottlenecks in the process.
Most synthesis happens in 1–5 days
When it comes to turning raw research data into actionable insights, time is often one of the most valuable – and limited – resources. Our survey data reveals clear patterns about how long synthesis typically takes and which activities consume the most time in the process.
The most common timeframe for synthesis is 1–2 days, with 35.0% of participants reporting this duration for their most recent research project. Another 30.3% reported spending 3–5 days on synthesis, meaning that nearly two-thirds of all synthesis work takes between 1–5 days to complete.
Quick synthesis (less than a day) is also relatively common, with 21% of participants completing their synthesis work within this timeframe.
Extended synthesis periods are less prevalent, with only 13.7% of participants reporting synthesis phases lasting more than 5 days.
This suggests that while synthesis is a critical component of the research process, most organizations focus on completing it within a relatively short timeframe.
The consistency of these timeframes across our survey indicates that these durations likely represent industry standards rather than sample-specific anomalies. The concentration of responses in the 1–2 day range may reflect practical constraints such as business pressures, time allocation limitations, or methodology standards that influence how much time can be dedicated to synthesis activities.
Why synthesis time varies
The time invested in synthesis appears to vary based on several factors:
Organization size matters: Participants from larger organizations (particularly those with 501–5,000 and 5,000+ employees) are more likely to report longer synthesis periods. This may reflect additional complexity, stakeholder involvement, and formal processes typical in larger organizations.
Job role influences duration: There appears to be a disproportionate representation of Marketing/Customer Insights professionals among those taking more than 5 days for synthesis, despite making up just 15.3% of the total sample.
Research type affects the timeline: Market research and competitive analysis frequently require more synthesis time, likely due to their broader scope and more complex data sets. Customer surveys with large sample sizes may also contribute to longer synthesis times.
What does this tell us? Put simply, who you are, where you work, and what you’re researching all play a role in how long synthesis takes. Some combinations just naturally need more time to do the job properly.
What tasks take the most time?
Understanding which specific tasks take the most time can help identify bottlenecks and opportunities for improvement. The most time-intensive tasks break down as follows:
Analysis activities:
Reading through responses/data (59.0%)
Organizing findings into a structure (57.3%)
Synthesis activities:
Identifying patterns and themes (55.0%)
Creating presentations/visualizations (49.0%)
Writing summaries (35.0%)
Collaborative synthesis:
Team alignment on findings (21.3%)
There’s a notable distinction between the time spent on data processing activities versus creating outputs, with presentations/visualizations (49.0%) and writing summaries (35.0%) reported as time-consuming by fewer participants.
Team alignment is reported as time-consuming by a relatively small portion of participants (21.3%), suggesting that once the data is processed, reaching consensus on findings is less of a time burden.
The consistency of these results across our survey strengthens the validity of these insights and suggests they represent genuine industry-wide challenges in the research workflow.
Efficiency bottlenecks
The data reveals several key bottlenecks in the analysis and synthesis process:
Data review backlog: Reading through responses/data is consistently the most time-consuming task.
Information overload: Structuring findings in a meaningful way consumes significant time, particularly with larger datasets.
Pattern recognition challenges: Identifying meaningful patterns across different data sources requires considerable time and cognitive effort.
These findings suggest that steps to streamline the research analysis and synthesis process might be most effective if focused on the data processing and pattern identification stages. Tools and methods that help automate initial data review, suggest ways to structure data, or assist with pattern recognition could potentially yield the greatest time savings.
The synthesis efficiency gap
Looking at the full picture of time invested in synthesis, we can see a clear opportunity for innovation.
While the industry has largely standardized around relatively short synthesis timeframes (1–5 days), the activities that fill those days remain labor-intensive and cognitively demanding.
As research volumes increase and teams face greater pressure to deliver insights quickly, addressing these time-intensive activities will become even more crucial for research effectiveness. The organizations that find ways to streamline these processes while maintaining insights quality will likely gain a significant competitive advantage.
The biggest synthesis frustrations
Despite many advances in tools and methodologies, analyzing and synthesizing research still comes with its fair share of challenges. Understanding these pain points is important for advancing the practice and developing solutions that address the needs of researchers and PWDR.
What are the top research synthesis pain points?
When we asked our participants about their biggest frustrations when synthesizing research findings, a clear hierarchy of pain points emerged.
Time-consuming manual work tops the list by a significant margin, cited by 60.3% of participants. This overwhelming consensus suggests that despite technological advances, the fundamental task of processing and organizing research data remains stubbornly labor-intensive. One designer shared:
“For a usability test, I tested with too many users and ended up with more data than I could efficiently synthesize. It took several days to analyze everything and extract actionable insights. Since then, I’ve started limiting the number of participants to keep the scope manageable and focused.”
Nearly half of participants (46.3%) struggle with synthesizing large volumes of data, while a similar proportion (41.3%) find it difficult to identify patterns across different data sources. These related challenges speak to the cognitive complexity of making sense of diverse, often unstructured information.
The actionability gap represents another significant challenge, with 39.3% of participants finding it frustrating to translate insights into recommendations stakeholders can use. This highlights the ongoing challenge of bridging research findings with strategic decision-making.
“One challenge I face frequently is turning findings into next steps, and getting everyone on the product team to align with those next steps and put them on the roadmap.”
Methodological concerns aren’t far behind, with one-third (33.0%) of participants worried about ensuring objectivity and reducing personal bias in their synthesis process. This awareness shows a healthy recognition of the potential for subjective interpretation to affect research outcomes.
Interestingly, communication challenges – whether communicating findings effectively (28.0%) or getting team alignment on key findings (16.7%) – rank lower than data processing and analytical frustrations. This suggests that once this phase is complete, sharing insights presents a comparatively smaller hurdle.
Skip the manual work
Ready to reduce synthesis time? Try Lyssna's AI-powered summaries and streamline your research analysis process.
How different roles experience synthesis challenges
Different roles experience synthesis challenges in distinct ways, offering a glimpse into how tools and methodologies might better serve diverse practitioners.
Time-consuming manual work
While manual work is universally frustrating, designers are disproportionately affected. Though designers represent approximately 40.3% of our total survey sample, they make up 42% of those citing manual work as a frustration.
Product managers feel this pain roughly proportionally to their representation in our sample (17.1% vs 19.7% overall), suggesting this frustration cuts across both design and product disciplines.
Marketers show distinct synthesis patterns that may explain their relationship with manual work frustrations. Representing 15.3% of our sample, they demonstrate notably different time investments in synthesis compared to other roles. While many roles cluster around shorter synthesis periods, marketers show a more distributed pattern:
35% of marketers spend more than 5 days on synthesis – significantly higher than typical patterns.
Another 48% spend 1–5 days on synthesis.
Only 18% complete synthesis in under a day.
This extended synthesis timeline for marketers likely reflects the different types of data they work with (often combining user research with market research, customer insights, and business metrics) and may explain why their experience with “time-consuming manual work” differs from roles focused primarily on user research data.
Surprisingly, dedicated UX researchers aren’t spared from manual work frustrations, despite their specialized training. They represent 9.4% of those citing this pain point, slightly higher than their 8.3% representation in the overall sample.
Independent consultants appear somewhat less burdened by manual work, perhaps because they’ve developed more efficient processes or specialized toolsets to address this common challenge.
Translating insights into actionable recommendations
The challenge of bridging research findings with actionable next steps reveals interesting role-based patterns. Designers struggle most significantly with this translation, representing 44.1% of those frustrated by this aspect – higher than their 40.3% overall representation.
This suggests they find the bridge between research findings and actionable design decisions particularly challenging.
Product managers cite this frustration at rates slightly lower than their overall representation (16.1% vs 19.7%), while UX researchers align almost exactly with their overall proportion (8.5% vs 8.3%). This suggests that even those with specialized research training find the translation to actionable recommendations challenging.
Marketing and customer insights professionals show interesting variability, with significant differences across our survey data, suggesting their translation challenges may be more context-dependent.
Ensuring objectivity and reducing personal bias
Methodological concerns around objectivity reveal perhaps the most striking role-based differences. Designers are significantly overrepresented in this category, making up 50.5% of those concerned about objectivity and bias – far above their 40.3% overall representation.
Product managers show slightly elevated concern (21.2% vs 19.7% overall), perhaps reflecting their position at the intersection of business objectives and user needs, where maintaining impartiality can be particularly challenging.
Marketing and customer insights professionals also show slight concern (18% vs 15.3% overall). This suggests that despite working in contexts where business-oriented interpretation is often expected, they remain conscious of the need to maintain objectivity when synthesizing research findings.
Surprisingly, UX researchers are underrepresented among those worried about objectivity (7.1% vs 8.3% overall). This may indicate that their training and experience gives them more confidence in their ability to maintain objectivity.
Independent consultants are notably less concerned about bias (4.0% vs. 12.7% overall), suggesting they may have developed effective techniques for maintaining objectivity through their autonomous work.
Synthesis struggles in the wild
While our quantitative data highlights the prevalence of specific frustrations, our open-text responses provide a deeper understanding about how these challenges manifest in day-to-day synthesis work.
Below, we explore five key themes that emerged when we asked participants to share specific challenges from their practice.
1. Data volume and management
The challenge of managing large volumes of data – which aligns with our top frustrations of “time-consuming manual work” and “synthesizing large volumes of data” – came to life through participants’ stories.
Manual handling of qualitative data proved particularly burdensome, especially for video reviews, interview transcriptions, and open-ended survey responses. One participant who works in Marketing/Customer Insights shared:
“One of the biggest challenges is organizing all of the data and structuring it in a way where I can easily compare different segmentations of the data to find different themes. For example, differences between iOS and Android users, or differences between Japanese users and Korean users. This is extremely time consuming to download the different segmentations of users from SurveyMonkey and import them into a spreadsheet where I can compare.”
Even with sophisticated tools at their disposal, it seems that practitioners struggle to structure and manage diverse information effectively.
2. Pattern identification and analysis
Identifying meaningful patterns across diverse data sources represents a fundamental synthesis challenge – and it’s one that many participants in our sample brought up.
Conflicting feedback from different user segments complicates pattern recognition. As one participant explained:
“Each group had vastly different pain points, making it hard to find a common thread for design decisions.”
There are additional complexities too, such as inconsistent data formats, language barriers, and cultural differences in terminology.
3. Stakeholder management tensions
While our quantitative data showed that “communicating findings effectively” (28.0%) and “getting team alignment” (16.7%) rank lower than data processing frustrations, our open-text responses revealed rich examples of the stakeholder challenges researchers and PWDR face.
Balancing stakeholder expectations creates significant pressure, with stakeholder biases being particularly common. Multiple participants described scenarios where stakeholders favor preconceptions over research findings:
“Even though the data showed a clear path of success for new product development the stakeholders were stuck on their own ideas, so I thought that I was not being effective in communicating the findings … Can be frustrating.”
4. Resource and methodology constraints
Reflecting the challenge of “time-consuming manual work” (60.3%), participants consistently report that time and budget limitations force trade-offs between rigor and speed. Documentation requirements consume significant time, while tool limitations persist despite technological advances.
For those in agency settings, balancing client pressures with methodological rigor presents a particularly acute challenge. One participant described working on a project with extensive discovery interviews:
“I didn't have time to do granular coding in Dovetail. Instead, I had to rely on the AI features with a combination of memory and notes.”
The result is a constant tension between doing thorough work and meeting deadlines – a balancing act that many practitioners know all too well.
5. Emerging AI solutions – with mixed results
Our survey found that researchers and PWDR are increasingly turning to AI tools like ChatGPT, or AI features integrated into research tools (like the Dovetail example mentioned above), to handle the overwhelming volume of qualitative data they face. While these tools offer promising efficiency gains, they’re not always perfect solutions.
Human oversight remains crucial, with many participants emphasizing the need to verify AI-generated insights and provide missing context:
“I largely rely on AI to help me synthesize data. The biggest challenge I face is that while AI can summarize responses and help me draw out insights, it fails at helping me structure and present it to stakeholders in a way that is easy for them to follow and consume without context of the entire research.”
Concerns about accuracy, data privacy, and sensitivity persist, leaving many cautiously optimistic but not yet ready to fully embrace AI-driven synthesis. (A theme we’ll see come up again later on.)
Despite the challenges, confidence remains high
The good news is that, despite these challenges, researchers and PWDR maintain a surprisingly positive outlook on their synthesis processes.
When asked to rate their confidence that their process captures all important insights, the vast majority (97%) expressed at least moderate confidence (3+ on a 5-point scale), with most (52%) feeling very confident.
Confidence correlates with experience in an interesting pattern:
Mid-career professionals (4–7 years) show solid confidence (3.70 mean).
Senior practitioners (8–12 years) display the highest confidence levels (3.75 mean) with the most “extremely confident” ratings (19%).
Veterans (13+ years) maintain strong confidence (3.73 mean) but are less likely to claim extreme confidence.
This suggests an intriguing confidence evolution: as people gain research experience, their confidence grows, but the most seasoned professionals develop a more measured view of synthesis capabilities – recognizing both its power and inherent limitations.
How synthesis happens: Methods, approaches, and tools
The tools and approaches researchers and PWDR use for analysis and synthesis can dramatically impact both efficiency and outcomes. Our data reveals a research community embracing a blend of collaborative human expertise and emerging AI capabilities, while still relying on trusted traditional methods.
From sticky notes to AI: Common analysis and synthesis methods
When we look at the methods teams are using to synthesize research, team debriefs and collaborative sessions (55.0%) narrowly edge out AI-assisted analysis (54.7%). This highlights the continued importance of human collaboration despite technological advances.
Affinity mapping remains popular (48.3%), as does manual coding/tagging (46.0%). Despite trends toward digital collaboration, in-person workshops are still used by over a third of participants (35.7%), suggesting the continued value of face-to-face synthesis activities.
Solo, team, or hybrid: How people tackle synthesis
When it comes to making sense of research data, practitioners have developed diverse strategies that balance efficiency, collaboration, and analytical rigor.
While synthesis is often portrayed as an inherently collaborative activity, our data reveals a more nuanced reality. Small team collaboration (41.0%) emerges as the most common approach, followed closely by solo efforts (34.0%).
When we include mixed approaches (18.0%) that combine individual synthesis with team validation, we see that 59.0% of participants incorporate some form of collaboration in their synthesis process. This highlights the social nature of sense-making in UX research, while still acknowledging the importance of individual analysis.
The prevalence of solo and small-team approaches has important implications for research tools and organizations:
Tools should prioritize features that support both individual analysis and small team collaboration.
Where possible, organizations should facilitate small team work on research projects to enable focused collaboration.
Training programs should emphasize methods that work well for both solo practitioners and small teams.
AI is transforming synthesis (but humans stay essential)
Perhaps the most striking finding is how rapidly AI has been integrated into the analysis and synthesis process. With 54.7% of participants now using AI-assisted analysis, artificial intelligence has become a core component of modern research practice. However, this adoption pattern also reveals nuanced usage rather than wholesale replacement of traditional methods.
When we examine how AI is specifically being applied, we see it’s being used for both analysis and synthesis tasks, with a clear pattern of trust and application:
Analysis tasks lead adoption: The overwhelming majority of AI users employ it for generating summaries of key findings (82.9%) and automatically categorizing responses (44.5%).
Synthesis tasks show strong adoption: Identifying themes or patterns (61.0%) and translating insights into recommendations (47.6%) represent core synthesis work where AI is gaining traction.
A trust gradient emerges: As tasks require more nuanced interpretation, AI usage drops. Fewer practitioners trust AI for analyzing sentiment (32.3%) or visualizing data (25.6%) – activities that require deeper contextual understanding.
An emerging workflow pattern becomes clear: AI handles initial processing (particularly summaries and pattern identification), which human teams then collaboratively interpret and validate. The significant drop-off between using AI for identifying patterns (61.0%) and translating insights into recommendations (47.6%) suggests a trust boundary – practitioners value AI for finding patterns but remain hesitant to delegate recommendation development.
This hybrid approach points to a future where AI augments rather than replaces human judgment – what’s commonly referred to as “human-in-the-loop” AI – especially for the collaborative sense-making that remains central to effective research synthesis.
Experience AI-assisted synthesis
Join the 54.7% using AI for research analysis. Get 10 free AI summaries on our free plan.
Tools for research synthesis
Beyond approaches and AI usage, our survey explored the specific tools researchers and PWDR rely on for synthesis work through an open-text question about their current toolkits. The results reveal a blend of specialized and general tools.
Specialized research platforms:
Dovetail (13 mentions) – the most frequently cited dedicated research tool.
NVivo (5 mentions) – particularly popular in academic and enterprise contexts.
Collaboration and AI tools gaining ground:
Miro (4 mentions) – for collaborative affinity mapping and synthesis sessions.
ChatGPT (4 mentions) – representing the integration of AI into synthesis workflows.
Supporting ecosystem: Practitioners also mentioned analytics platforms (Google Analytics, Meta Business Suite), academic tools (Zotero, Google Scholar), transcription solutions (Fathom, Otter), and general collaboration software (Notion, Airtable, Figma).
Tool usage patterns
Our analysis reveals several key patterns in how tools are used across different organizational contexts:
General-purpose tools form the foundation: Most synthesis work relies on widely available collaboration and productivity platforms, with specialized research software used more selectively for specific tasks.
Multiple tools are the norm: Practitioners typically integrate several different tools throughout their synthesis workflow rather than relying on a single solution, creating customized processes that combine the strengths of different approaches.
Small organizations show different patterns: While smaller companies (1–50 employees) maintain collaborative approaches at similar rates to larger organizations, they show significantly less reliance on manual coding/tagging (31% compared to 46% overall). Their higher AI adoption rate (59% vs 54.7% overall) suggests that technology may serve as a “team extender” in resource-constrained environments.
Organization size doesn’t impact specialized tool adoption: Specialized research tool usage is nearly identical between small organizations and the overall sample, suggesting these products may not be effectively addressing the specific needs of different sized organizations.
These findings illustrate a research landscape in transition – one that embraces technological innovation while preserving the collaborative, human elements that have traditionally defined qualitative research. Rather than replacing established methods, technology is being integrated into existing workflows, creating hybrid approaches that combine automation with human judgment.
How research insights reach stakeholders
The journey from data collection to meaningful impact ultimately depends on how effectively research insights are communicated to stakeholders and decision-makers.
Our survey reveals clear patterns in how researchers share their findings and which methods yield the greatest influence.
Presentations remain the cornerstone of research communication, with over three-quarters of participants (75.3%) using presentations to share insights, making it by far the most common method. This suggests that synchronous, face-to-face communication continues to be the gold standard for conveying research findings, whether it’s in-person or via video conference.
Visual summaries (55.7%) are the second most popular method, highlighting that visually representing data is considered essential for effective stakeholder communication, outranking text-heavy formats. This preference for visual communication reflects the understanding that complex insights often become more accessible and memorable when presented visually.
Brief executive summaries (36.0%) are more commonly used than detailed written reports (31.0%), indicating a preference for concise communication that respects stakeholders’ time constraints.
It’s clear most practitioners use multiple formats to communicate insights, suggesting a multi-channel approach to reach different stakeholder needs. This approach acknowledges that different stakeholders may process and engage with information in different ways.
Opportunities for innovation in research communication
While presentations and visual summaries dominate the communication landscape, their effectiveness varies depending on organizational context and stakeholder preferences. Interactive methods, though currently underutilized, show promise for increasing engagement and driving action based on research insights.
Team workshops (21.0%) and interactive dashboards (17.3%) remain relatively uncommon, suggesting barriers to implementation or perceived effectiveness. Similarly, video recordings/summaries (14.7%) are the least utilized formal method, despite the rise of video communication in other business contexts, indicating potential untapped opportunities.
The future of research analysis and synthesis
Research analysis and synthesis is evolving rapidly in 2025. As AI capabilities expand and business pressures for faster insights intensify, understanding what makes synthesis valuable – and what practitioners need to improve – becomes crucial for organizations investing in research.
What makes analysis and synthesis valuable?
When we asked participants about the most valuable outcome of good research synthesis, customer-centricity dominated. More than 2 in 5 participants (41.7%) identified more customer-centric products as the top value driver, emphasizing the direct connection between research and product improvement.
This was followed by faster decision-making (18.7%) and reduced risk of product failures (17.7%), both efficiency-focused outcomes that demonstrate practical business impact.
Interestingly, internal organizational benefits like better resource allocation (7.0%), team alignment (6.7%), and increased innovation (7.0%) ranked much lower, suggesting that synthesis is primarily valued for its external market impact rather than internal process improvements.
What researchers need to improve
When we asked what would help improve the research synthesis process, clear priorities emerged.
1. Better tools lead the wish list
Analysis and synthesis tools (31.0%) and clear frameworks/templates (28.0%) topped the list, suggesting practitioners seek structural support rather than just more time or resources.
2. Collaboration and integration matter
Team collaboration opportunities (23.7%) and better integration with existing workflows (22.3%) highlight how synthesis challenges often stem from organizational silos and disconnected systems.
3. Skills development is valued
Training in advanced techniques (21.7%) and access to examples (20.7%) show that practitioners recognize skill gaps and want continued professional development.
Notably, more time for synthesis (17.0%) ranked relatively low, suggesting researchers see greater value in working smarter rather than longer. As one participant noted:
“Streamlining this process can shorten the time between research and decision-making, which is critical for keeping pace with fast-moving product development. Delays in synthesis can ripple across teams (like design and engineering), slowing down iterations and delivery.”
AI as the future of synthesis
These immediate needs become even more relevant when considering how AI is reshaping synthesis work. As we’ve already explored, the overwhelming majority of participants see AI as central to the future of research synthesis (with one participant even joking, “I don't think it’s a survey in 2025 unless you mention AI!”).
They anticipate AI taking on time-consuming tasks like data organization, pattern identification, and summary generation, with many foreseeing a shift toward continuous, “always-on” synthesis:
“With the rise of AI and machine learning, there will be more tools capable of auto-tagging, summarizing, and even identifying patterns in research data. This won’t replace human analysis, but it will significantly reduce the time spent on initial synthesis and allow designers and researchers to focus on interpreting insights strategically.”
However, practitioners want augmentation, not replacement. Concerns about maintaining quality and reliability emerged alongside enthusiasm for speed:
“I think there will need to be processes in place to protect participant data more strongly as more folks rely on AI. And also, AI hallucinations. How can we reduce how often and the severity of those that we see.”
Another participant shared:
“It needs to be more personal and human. There are a lot of AI tools nowadays that can transcribe, summarize, analyze ... but the human aspect gets lost. How can we capture what users and customers feel or think beyond what they say or do?”
The consensus points toward collaborative human–AI synthesis – a human-in-the-loop approach where technology handles routine tasks while humans focus on interpretation and strategic application.
What organizations should do next
Based on these findings, organizations should:
Invest in data processing tools: Address the biggest pain point by automating raw data organization and initial pattern identification
Create standardized frameworks: Develop consistent templates and processes for synthesis work. This addresses practitioners’ second most desired improvement (28.0%) and helps ensure quality regardless of who’s doing the analysis.
Embrace AI strategically: Use it for summarization and initial analysis while preserving human judgment for interpretation.
Foster small team collaboration: Create structured ways for synthesis work to happen collaboratively rather than in isolation.
Looking ahead, we see research synthesis continuing to evolve in response to business pressures and technological advances. The push for faster insights will intensify, driving further adoption of AI and automation tools. However, the human elements of synthesis – the ability to interpret nuance, understand context, and connect insights to strategy – will remain essential.
The most successful teams will be those that find the right balance: leveraging technology to handle the mechanical aspects of synthesis while preserving the collaborative human judgment that transforms information into genuine insights. They’ll develop clear workflows that integrate AI assistance without losing the richness of direct engagement with research data.
As one participant aptly put it:
“I think we will need to show the value of a human doing this with the HELP of AI and not as something AI can solely do on its own.”
This perspective captures the essence of where synthesis is headed – not toward full automation, but thoughtful augmentation that combines the best of human and machine capabilities.
By embracing this hybrid approach and addressing the key challenges identified in this report, teams can get greater value from their research efforts and drive more informed, user-centered decisions across their organizations.
Transform your synthesis process
Ready to move from chaos to clarity? Try Lyssna for free and experience smarter research.
Ready to improve your synthesis process?
Thank you to all the practitioners who contributed their experiences and insights to this report. Your experiences provide a valuable window into the evolving practice of research synthesis in 2025.
And thank you for reading – we really appreciate you taking the time to explore these insights with us.
If you’re looking to improve your research analysis and synthesis process, here are a few ways Lyssna can help.
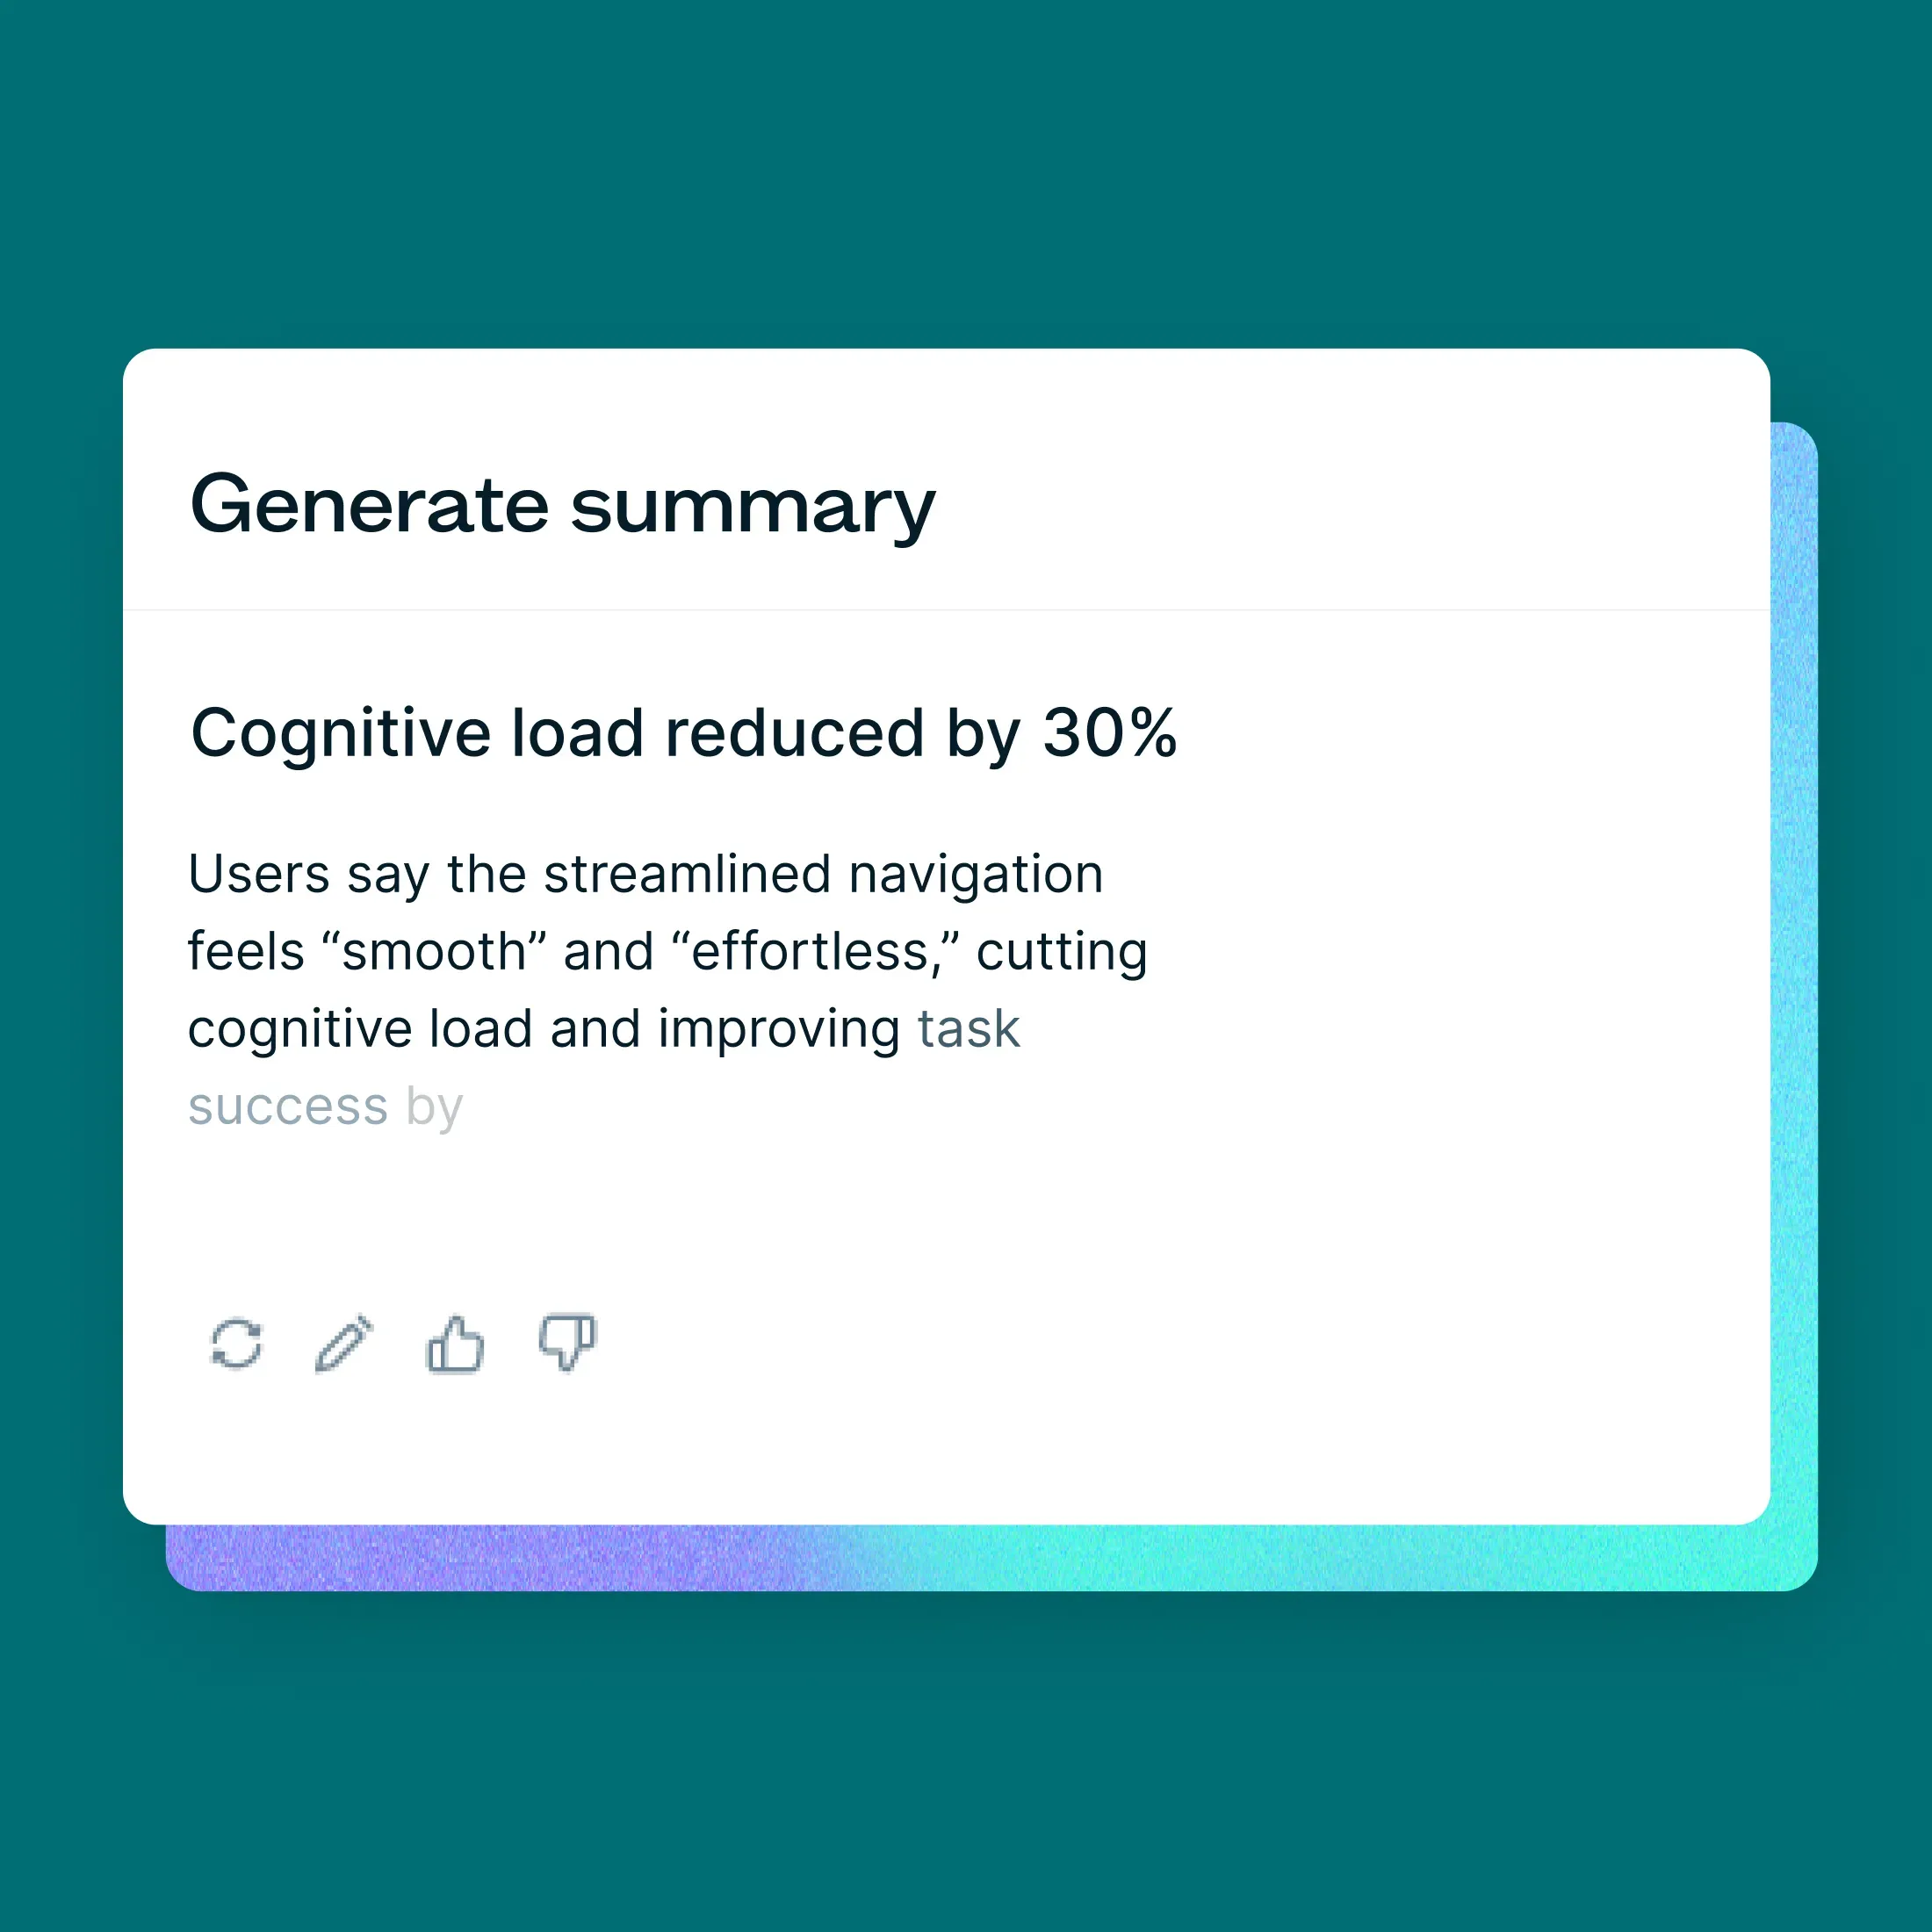
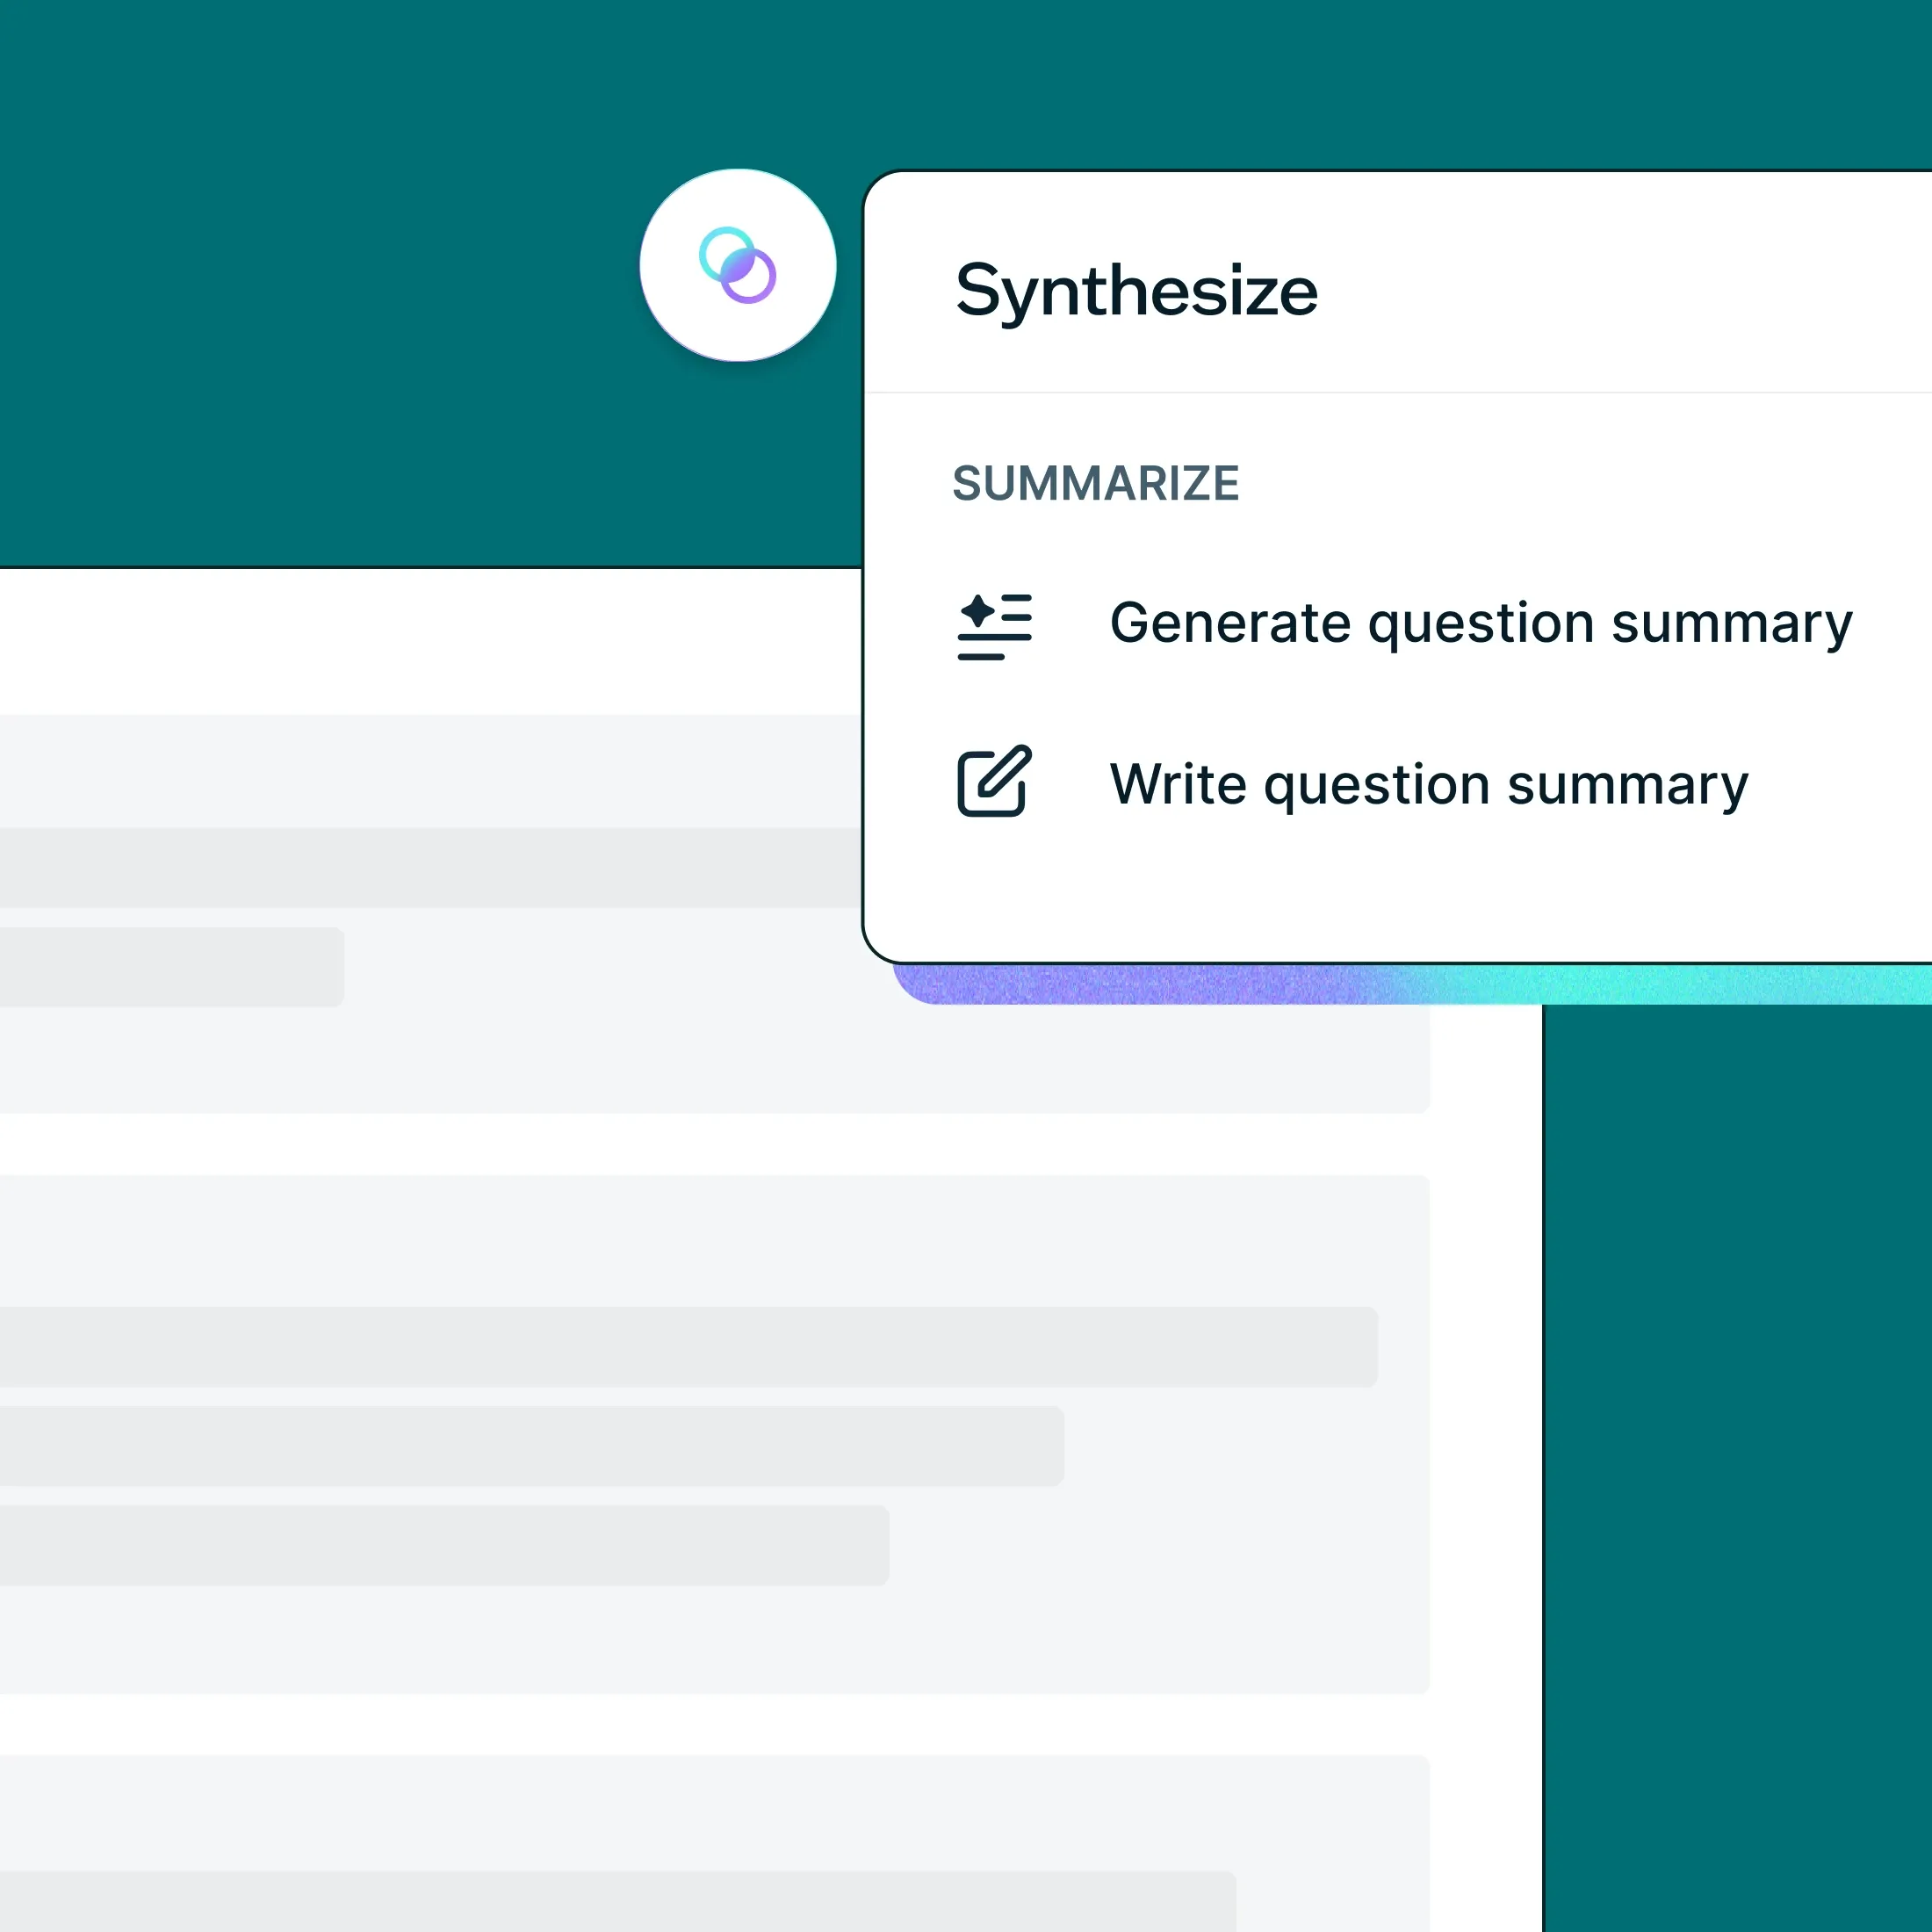
Streamline your synthesis with AI-powered summaries
Our AI-powered Synthesize feature directly addresses one of the key pain points identified in this report: time-consuming manual work. With Synthesize, you can quickly transform raw feedback into clear, actionable insights while maintaining control over the narrative.
Every free plan user gets 10 free AI-generated summaries to experience how this feature can enhance your workflow. Whether you’re a dedicated researcher or someone who occasionally conducts usability tests, using AI generated summaries can help you identify patterns and themes more efficiently.
Run more effective research with Lyssna
Lyssna is an all-in-one user research platform trusted by over 320,000 researchers, designers, and product teams. With Lyssna, you can:
Test with your target audience: Recruit participants from your own network or access our research panel of 690,000+ participants across 124 countries.
Choose from multiple research methods: Conduct user interviews, card sorting, tree testing, first click testing, surveys, prototype tests, and more.
Collaborate with your team: Share findings, review results together, and build a research practice that scales.
Get results quickly: On average, orders are fulfilled in just 30 minutes, saving you valuable time.
Book a demo to see Lyssna in action
Want to see how Lyssna can help depending on your specific research needs? Our team would be happy to walk you through our platform and discuss how it can address your unique challenges.
Whether you’re looking to conduct more efficient research, improve your synthesis process, or just stay updated on the latest trends, we’re here to support your research journey.
--
Diane Leyman is the Senior Content Marketing Manager at Lyssna. She has extensive experience in content strategy and management within the SaaS industry, along with a background in editorial and content roles across the publishing and not-for-profit sectors.
You may also like these articles


Try for free today
Join over 320,000+ marketers, designers, researchers, and product leaders who use Lyssna to make data-driven decisions.
No credit card required