Card sorting guide
Learn what card sorting is, how to run open, closed, moderated, and unmoderated studies. Discover best practices, examples, and how to analyze card sorting data.
Card sorting guide
Card sorting takes the guesswork out of organizing information. When users can't find what they need, the problem often lies in how content is structured.
In card sorting, participants group topics into categories that make sense to them, revealing how they naturally think about and organize information.
This UX research technique provides the foundation for intuitive navigation and information architecture. Whether you're designing a new website, reorganizing an app, or validating your current structure, card sorting offers direct insights into your users' mental models.
This guide covers everything you need to know: what card sorting is, when to use different types, how to run effective studies, and how to turn results into actionable design decisions.
Key takeaways
Card sorting reveals how users naturally organize and label information, taking the guesswork out of navigation design.
Open card sorting lets users create their own categories – ideal for new projects – while closed card sorting validates existing structures.
Hybrid card sorting combines both approaches, letting participants sort into predefined categories while creating their own — ideal when you want to validate your structure and discover what you might have missed.
The method works for any information organization challenge, from website menus to app navigation to product taxonomies.
15-30 participants typically provide enough data to identify meaningful patterns in how users group content.
Results translate directly into actionable decisions about site structure, menu organization, and category labels.
Test your information architecture
Discover how users naturally organize your content. Sign up for a free Lyssna plan and create your first card sort today.

What is card sorting?
Card sorting is a technique where participants organize topics into categories that make sense to them. This user research method helps teams understand how people naturally group and label information, making it invaluable for creating intuitive information architectures.
Definition
Card sorting is a well-established UX method where participants group topics into categories according to criteria that make the most sense to them. During a card sorting session, participants receive a set of cards (either physical or digital) representing different pieces of content, features, or concepts. They then organize these cards into groups that feel logical and meaningful to them.
The beauty of card sorting lies in its simplicity. Rather than asking users to explain complex mental models through interviews alone, card sorting provides a hands-on way for participants to demonstrate their thinking. This makes abstract concepts tangible and reveals patterns that might not emerge through other research methods.
Purpose
Card sorting helps design or improve information architecture (IA) and navigation by revealing how users expect information to be organized. The primary purposes include:
Validating existing structures: Test whether your current organization makes sense to users.
Informing new designs: Create navigation systems based on user mental models.
Reducing cognitive load: Organize content in ways that feel natural to your audience.
Improving findability: Help users locate information more efficiently.
Building consensus: Provide objective data to resolve internal debates about organization.
How it works
Users group "cards" (physical or digital) with labels, menus, or content items into categories that make sense to them. You can run a card sorting session in person using physical cards, or remotely using online tools like Lyssna.
The card sorting process typically involves:
Preparation: Create cards representing your content or features.
Instructions: Explain the task to participants without influencing their thinking.
Sorting: Participants organize cards into groups.
Labeling: Participants name their categories (in open card sorts).
Analysis: Look for patterns across multiple participants' sorts.
Remote card sorts are affordable, simple to create, and easy to recruit and share with participants. Online card sorting tools have reporting capabilities built in, so you can view, sort, and analyze data quickly.
"Lyssna provides some great features to test UX flows, conduct AB testing, card sorting, etc. It's an easy to use software and surveys are very quick and easy to set up."
– Ranjan N., G2 review
What is card sorting used for?
Card sorting helps teams make informed decisions about organizing and presenting information. It reveals how users naturally group content, what terminology resonates with them, and how they expect to navigate through information.
Card sorting purpose | What it reveals | Use it to |
|---|---|---|
Improve information architecture | How users naturally group related concepts | Design menus, categories, and site structures that match user expectations |
Test label clarity | Whether users understand your terminology | Identify confusing labels, avoid jargon, and create consistent naming conventions |
Understand mental models | The logic users apply when organizing content | Build intuitive interfaces that reduce cognitive load |
Optimize navigation | How users expect to move through information | Create logical page hierarchies, breadcrumbs, and filtering systems |
Improving information architecture
Card sorting validates how menus, categories, and content should be structured by revealing the organizational patterns that feel most natural to your users. When you understand how people group related concepts, you can create navigation systems that align with their expectations.
For example, say you're creating an ecommerce furniture website. Would your customers expect to see desks, office chairs, and shelving listed as separate categories? Or are they more likely to navigate to 'home office'? Card sorting helps answer these questions with real user data rather than assumptions.
This method is particularly valuable when:
Launching new websites or applications
Restructuring existing navigation systems
Merging multiple sites or product lines
Expanding into new content areas or product categories
Testing label clarity
Card sorting reveals whether users understand terms and headings by showing how they interpret and group labeled content. If participants consistently place cards in unexpected categories, it often indicates that your labels aren't communicating what you intended.
The Nielsen Norman Group advises against using terms that contain the same words, as participants tend to group these cards together. For example, most participants will group 'Strawberry planting' and 'Strawberry growing' together, because 'Strawberry' is repeated.
This insight helps teams:
Identify confusing or ambiguous terminology
Choose labels that resonate with users
Avoid industry jargon that users don't understand
Create consistent naming conventions across products
Identifying user mental models
Card sorting shows how users expect information to be grouped by revealing the underlying logic they apply when organizing content. These mental models represent the frameworks people use to understand and navigate information spaces.
Understanding user mental models helps teams:
Design interfaces that feel intuitive from the first interaction
Predict where users will look for specific information
Create logical groupings that reduce cognitive load
Build navigation systems that support user goals
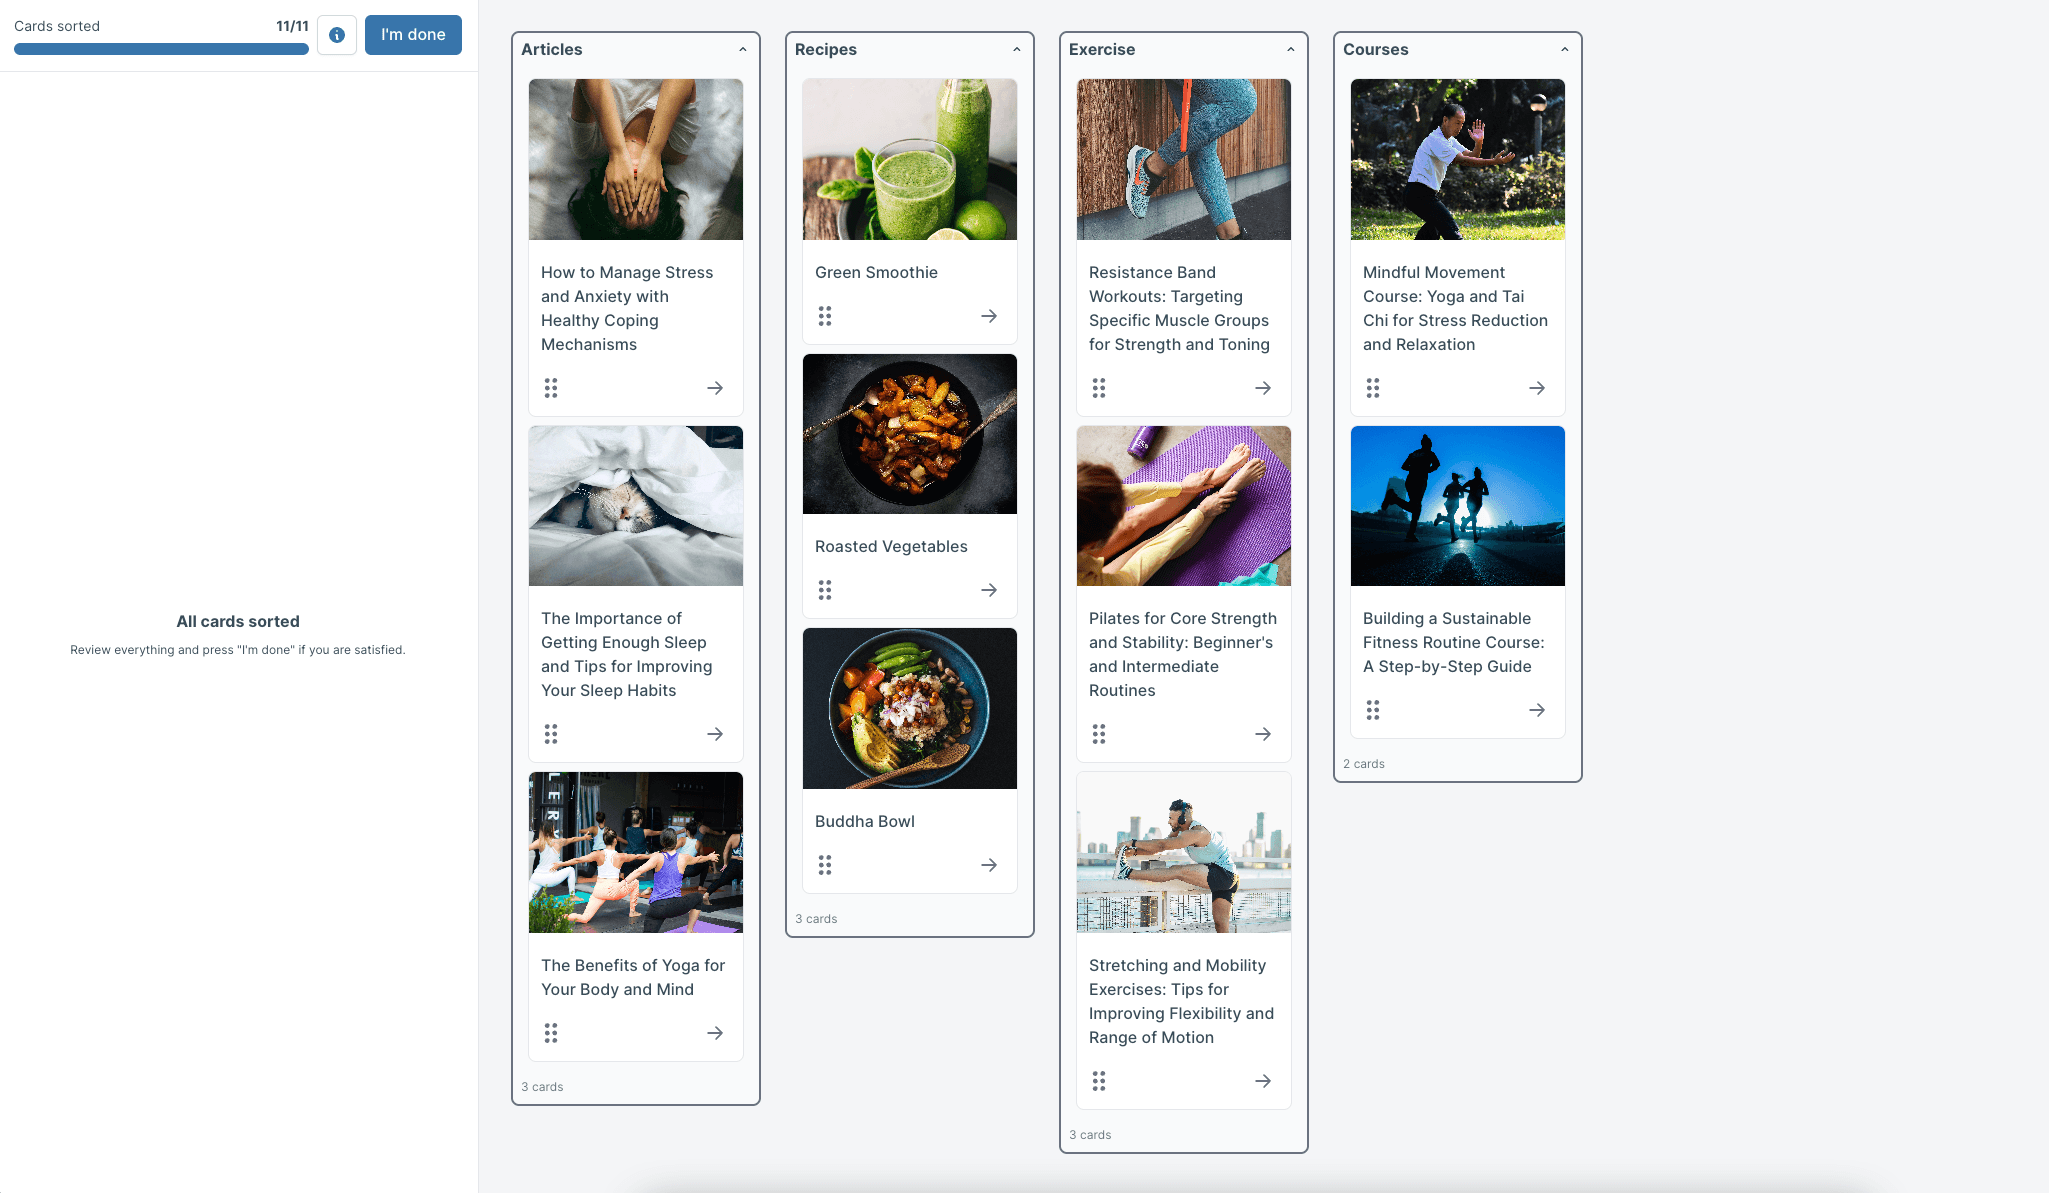
For instance, how would readers of your food blog expect to see recipes sorted – by meal type, course, cuisine, diet, season, or ingredient? Card sorting reveals which organizational schemes resonate most strongly with your audience.
Optimizing navigation flows
Card sorting informs sitemap design and product taxonomy by providing data-driven insights into how users expect to move through information hierarchies. This helps create navigation flows that support natural user journeys rather than forcing users to adapt to arbitrary organizational schemes.
The method helps teams:
Design logical page hierarchies
Create intuitive breadcrumb systems
Develop effective search and filtering options
Plan user flows that align with mental models
Closed card sorting
Closed card sorting provides a structured approach to validating existing information architectures by asking participants to organize content within predefined categories.
Definition
In closed card sorting, participants place cards into predefined categories that you provide. Rather than creating their own groups, participants work within the constraints of your existing or proposed organizational structure.
Closed card sorting works well when you have a specific structure in mind and want to test whether users can successfully categorize content within that framework.
The predefined categories might represent your current navigation menu, proposed new structure, or industry-standard organizational schemes.
Benefits
Closed card sorting is efficient for validating existing structures because it provides clear, comparable data across participants. Key benefits include:
Faster analysis: Results are easier to quantify and compare since everyone uses the same categories.
Direct validation: Shows whether your proposed structure works for users.
Clearer insights: Reveals specific problem areas in existing organizations.
Stakeholder buy-in: Provides concrete data to support or challenge current approaches.
Resource efficiency: Requires less time for both participants and researchers.
Limitations
Closed card sorting does not reveal new groupings outside the predefined options, which can limit the insights you gain. Important limitations include:
Constrained thinking: Participants can't suggest alternative organizational schemes.
Forced choices: Users might place cards in categories that don't feel quite right.
Missing opportunities: You might overlook better organizational approaches.
Confirmation bias: Results might confirm existing structures even when alternatives would be better.
Why use closed card sorting | Trade-offs to consider |
|---|---|
Faster analysis | Constrained thinking |
Direct validation | Forced choices |
Clearer insights | Missing opportunities |
Stakeholder buy-in | Confirmation bias |
Resource efficiency |
Open card sorting
Open card sorting offers maximum flexibility by allowing participants to create their own categories and labels, revealing natural user mental models without constraints.
Definition
In open card sorting, participants create their own categories and labels for organizing the cards. This approach provides complete freedom for users to group content according to their own logic and terminology.
Open card sorting works particularly well in the early stages of design when you want to understand how users naturally think about your content domain.
Participants not only organize cards into groups but also create names for those groups, providing insights into both organizational patterns and preferred terminology.
Benefits
Open card sorting reveals user-driven groupings and natural mental models that you might not have considered. Key advantages include:
Unbiased insights: No predetermined structure influences participant thinking.
Natural terminology: Discover the words users actually use to describe categories.
Unexpected patterns: Uncover organizational schemes you hadn't considered.
Rich qualitative data: Understand the reasoning behind user groupings.
Innovation opportunities: Identify new ways to organize content that better serve user needs.
For an open card sort, 30–50 cards should allow you to gain useful data about how your audience categorizes the cards without overwhelming participants.
Limitations
Open card sorting is harder to analyze and standardize because each participant creates unique categories with different labels. Challenges include:
Analysis complexity: Requires more time to identify patterns across diverse groupings.
Inconsistent terminology: Different participants use different words for similar concepts.
Difficult comparison: Harder to quantify and compare results across participants.
Implementation challenges: Translating diverse mental models into a single navigation system.
Why use open card sorting | Trade-offs to consider |
|---|---|
Unbiased insights | Analysis complexity |
Natural terminology | Inconsistent terminology |
Unexpected patterns | Difficult comparison |
Rich qualitative data | Implementation challenges |
Innovation opportunities |
How to choose between open, hybrid, and closed card sorting
Selecting the right card sorting approach depends on your research goals, project stage, and available resources. Understanding when to use each method helps ensure you gather the most valuable insights for your specific situation.
Use open card sorting when: | Use hybrid card sorting when: | Use closed card sorting when: |
|---|---|---|
Starting new projects: You're designing a completely new website or application | Testing in-progress structures: Your proposed IA isn't final and you want to pressure-test it before committing. | Testing current structures: You want to evaluate how well your existing navigation works |
Exploring possibilities: You want to understand all possible ways users might organize content | Bridging exploration and validation: You want to check your categories work while remaining open to ones you haven't considered. | Comparing alternatives: You have specific organizational options to evaluate |
Questioning assumptions: Your team has different opinions about the best organizational approach | Resolving placement problems: Previous closed sorts surfaced cards that participants consistently struggled to place. | Refining categories: Your basic structure is solid but needs fine-tuning |
Discovering terminology: You need to understand what words users prefer for categories | Combining two studies into one: You need both validation and discovery but have limited time or budget. | Limited flexibility: Technical or business constraints limit your organizational options |
Innovation focus: You're open to completely new organizational schemes | Suspecting gaps: Your structure feels mostly solid, but you're not confident it captures everything users expect. | Quick validation: You need fast, quantifiable results to inform immediate decisions |
When to use open card sorting
Open card sorting works best for early exploration or when building information architecture from scratch. Choose this approach when:
Starting new projects: You're designing a completely new website or application.
Exploring possibilities: You want to understand all possible ways users might organize content
Questioning assumptions: Your team has different opinions about the best organizational approach.
Discovering terminology: You need to understand what words users prefer for categories.
Innovation focus: You're open to completely new organizational schemes.
Pro tip: Open card sorting provides the richest insights when you have the flexibility to implement whatever organizational structure emerges from user data.
When to use hybrid card sorting
Hybrid card sorting works best when you have an existing structure to validate but want to stay open to what you might have missed. Choose this approach when:
Testing in-progress structures: Your proposed IA isn't final and you want to pressure-test it before committing.
Bridging exploration and validation: You want to check your categories work while remaining open to ones you haven't considered.
Resolving placement problems: Previous closed sorts surfaced cards that participants consistently struggled to place.
Combining two studies into one: You need both validation and discovery but have limited time or budget.
Suspecting gaps: Your structure feels mostly solid, but you're not confident it captures everything users expect.
When to use closed card sorting
Closed card sorting is ideal for validating or refining an existing information architecture. Use this method when:
Testing current structures: You want to evaluate how well your existing navigation works.
Comparing alternatives: You have specific organizational options to evaluate.
Refining categories: Your basic structure is solid but needs fine-tuning.
Limited flexibility: Technical or business constraints limit your organizational options.
Quick validation: You need fast, quantifiable results to inform immediate decisions.
Factors to consider
Several factors should influence your choice between open and closed card sorting:
Stage of design
Project goals
Available resources
Team consensus
Implementation constraints
Factor | Open card sorting | Closed card sorting |
|---|---|---|
Stage of design | Early exploration | Later validation |
Project goals | Discovery and innovation | Validation and optimization |
Available resources | Requires more analysis time | Provides faster, more straightforward results |
Team consensus | Helps when teams disagree about organization | Works when you need to validate agreed-upon approaches |
Implementation constraints | Works best when you can implement any organizational scheme | Suits situations with technical or business limitations |
Hybrid card sorting
Hybrid card sorting combines elements of both open and closed approaches – participants sort cards into predefined categories you've provided, but they can also create their own groups if something doesn't fit.
This makes it a useful option when you're not starting from scratch but aren't ready to lock in your structure either. You get the validation of closed sorting alongside the discovery of open sorting, without needing to run two separate studies.
Benefits
Hybrid card sorting is well suited to situations where you have a proposed structure to test but want to stay open to what you might have missed. Key benefits include:
Validation plus discovery: Test your existing categories while remaining open to new ones participants might surface.
More realistic behavior: Participants aren't forced into categories that don't feel right to them, which leads to more natural sorting decisions.
Richer analysis: You can compare how participants used your predefined categories versus the ones they created themselves — revealing gaps in your current thinking.
Fewer studies: Combines two research questions into one, saving time without sacrificing insight.
Limitations
Hybrid card sorting is more complex to analyze than closed sorting, and requires some upfront thinking about category design. Considerations include:
Analysis overhead: You'll need to review both predefined category usage and participant-generated groups, which takes more time than a straight closed sort.
Category influence: Your predefined categories can still anchor participant thinking, even when they have the freedom to create new ones.
Interpretation nuance: Understanding why participants created new categories – and what that means for your IA – requires careful review of the qualitative patterns.
Why use hybrid card sorting | Trade-offs to consider |
|---|---|
Structured flexibility | Complex analysis |
Validation plus discovery | Unclear boundaries |
Practical insights | Inconsistent results |
Balanced effort | Implementation confusion |
Moderated card sorting
Moderated card sorting involves a facilitator who guides participants through the process, asking questions and gathering qualitative insights alongside the sorting data.
Definition
In moderated card sorting, a moderator guides participants live, asking clarifying questions and encouraging participants to think aloud as they work.
This approach combines the quantitative data of card sorting with rich qualitative insights about participant reasoning.
The moderator can probe deeper into participant thinking, ask about difficult decisions, and understand the logic behind groupings. This makes moderated sessions particularly valuable for understanding not just what participants do, but why they do it.
Pro tip: You can do hybrid card sorting in Lyssna by creating a self-recruitment link and interviewing a participant as they take the test.
Benefits
Moderated card sorting provides rich qualitative insights and explanations that help teams understand the reasoning behind participant decisions. Key advantages include:
Deep understanding: Learn why participants make specific grouping decisions.
Real-time clarification: Ask follow-up questions when participants seem uncertain.
Contextual insights: Understand how participants' backgrounds influence their thinking.
Problem identification: Spot confusion or difficulty as it happens.
Relationship building: Create stronger connections with users through direct interaction.
Limitations
Moderated card sorting is more time-intensive and resource-heavy than unmoderated approaches. Challenges include:
Scheduling complexity: Coordinating times that work for both researchers and participants.
Facilitator bias: Moderator questions or reactions might influence participant behavior.
Limited scale: Practical constraints limit the number of participants you can include.
Higher costs: Requires more researcher time and often participant incentives.
Analysis burden: Qualitative data requires additional time to process and synthesize.
Why use moderated card sorting | Trade-offs to consider |
|---|---|
Deep understanding | Scheduling complexity |
Real-time clarification | Facilitator bias |
Contextual insights | Limited scale |
Problem identification | Higher costs |
Relationship building | Analysis burden |
Unmoderated card sorting
Unmoderated card sorting allows participants to complete the sorting process independently, typically through online platforms, making it a scalable and efficient research method.
Definition
In unmoderated card sorting, participants complete the sort independently, usually via online tools, without a researcher present. Participants receive instructions and complete the task on their own schedule, submitting results through the research platform.
Unmoderated card sorting leverages technology to scale research efforts, allowing teams to gather data from many participants quickly and cost-effectively. Participants can complete the task when convenient for them, removing scheduling barriers that often limit research participation.
Benefits
Unmoderated card sorting is scalable, fast, and cost-efficient, making it accessible for teams with limited research resources. Key advantages include:
Scale efficiency: Collect data from many participants simultaneously.
Cost effectiveness: Lower per-participant costs than moderated sessions.
Scheduling flexibility: Participants complete tasks when convenient for them.
Reduced bias: No moderator present to influence participant behavior.
Quick turnaround: Results available as soon as participants complete the task.
Geographic reach: Include participants from diverse locations easily.
Limitations
Unmoderated card sorting provides less qualitative feedback compared to moderated sessions, limiting your understanding of participant reasoning. Constraints include:
Limited context: No opportunity to ask why participants made specific decisions.
Unclear motivations: Difficult to understand the logic behind groupings.
No clarification: Can't help participants who might be confused by instructions.
Surface-level insights: Results show what participants did but not their thought process.
Technical issues: Participants might encounter problems without support available.
Why use moderated card sorting | Trade-offs to consider |
|---|---|
Scale efficiency | Limited context |
Cost effectiveness | Unclear motivations |
Scheduling flexibility | No clarification |
Reduced bias | Surface-level insights |
Quick turnaround | Technical costs |
Geographic reach |
How to run an unmoderated card sort
Running an effective unmoderated card sort requires careful planning and clear execution. Follow these steps to ensure you gather meaningful insights that inform your design decisions.
The below interactive demo also gives a picture of how to run a card sort in Lyssna.
Step 1: Define your goal
Before creating your card sort, clarify what you want to learn about labels, information architecture, or categories. Clear goals guide every other decision in your research process.
Common card sorting goals include:
Testing current navigation: Understand how well your existing structure works for users.
Exploring new organization: Discover how users naturally group your content.
Validating proposed changes: Test whether planned restructuring makes sense to users.
Comparing alternatives: Evaluate different organizational approaches.
Understanding terminology: Learn what words users prefer for categories.
Step 2: Select a tool
Choose a card sorting tool that meets your research needs and budget. Lyssna offers comprehensive card sorting capabilities with built-in analysis tools and participant recruitment options.
Tool consideration | What to look for |
|---|---|
Ease of use | Simple setup for researchers and intuitive interface for participants |
Analysis features | Built-in reporting and visualization capabilities |
Participant recruitment | Access to research panels or easy sharing options |
Integration capabilities | Compatibility with your existing research workflow |
Cost structure | Pricing that fits your research budget and frequency |
Step 3: Create cards
Begin by brainstorming your cards and categories. Pull together all the information you can, like your sitemap or product inventory list. You might even find it beneficial to run a content audit on your site to get a full list of your existing content.
Use realistic items like menu options, product categories, or feature names that represent your actual content. Make sure each card is easy to understand and represents a single concept. The information you provide on each card needs to be clear. If your participants don't understand the meaning, you're likely to end up with inconsistent categories.
Card creation best practices:
Use familiar language: Write cards in terms your users understand, avoiding internal jargon.
Keep cards focused: Each card should represent one clear concept or piece of content.
Make cards scannable: Use concise labels that participants can quickly process.
Ensure clarity: Test card labels with colleagues to identify potential confusion.
Consider context: Include enough information for participants to understand what each card represents.
Images can be a good way to illustrate concepts or items, or help to clarify text when cards might be ambiguous or unfamiliar to participants.
While the Lyssna test builder supports a maximum of 100 cards and 30 categories, we recommend showing around 30–40 cards per participant to maintain engagement and avoid cognitive overload.
Step 4: Recruit participants
Target the right audience for relevance by recruiting participants who match your actual user base. The quality of your participants directly impacts the value of your insights.
Recruitment strategies:
User database: Invite existing customers or users who know your product.
Social networks: Share with relevant communities and groups.
Professional networks: Reach out through LinkedIn or industry connections.
Research panels: A recruitment panel – like the Lyssna research panel – can be a quick and easy option, especially if you're looking for a large testing group or participants with specific demographics.
Participant requirements:
Relevant experience: Participants should have experience with your type of product or content.
Representative demographics: Match your actual user base in key characteristics.
Adequate sample size: Plan for 15-30 participants for meaningful patterns.
Clear expectations: Communicate time requirements and task complexity upfront.
Step 5: Run the test
Launch the card sort online and monitor participation to ensure you're gathering quality data. Most unmoderated card sorts run for several days to allow participants to complete the task when convenient.
During the test:
Monitor completion rates: Track how many participants start and finish the task
Watch for patterns: Look for early signs of confusion or technical issues
Provide support: Be available to answer participant questions if they arise
Maintain momentum: Send gentle reminders to participants who haven't completed the task
Step 6: Collect and analyze data
Look for grouping patterns, similarities, and disagreements across participants to identify meaningful insights for your information architecture decisions.
Analysis method | What it reveals |
|---|---|
Pattern identification | Cards that participants consistently group together |
Disagreement analysis | Cards that participants sorted inconsistently |
Category naming | The labels participants created for their groups |
Statistical analysis | Similarity matrices that quantify relationships between cards |
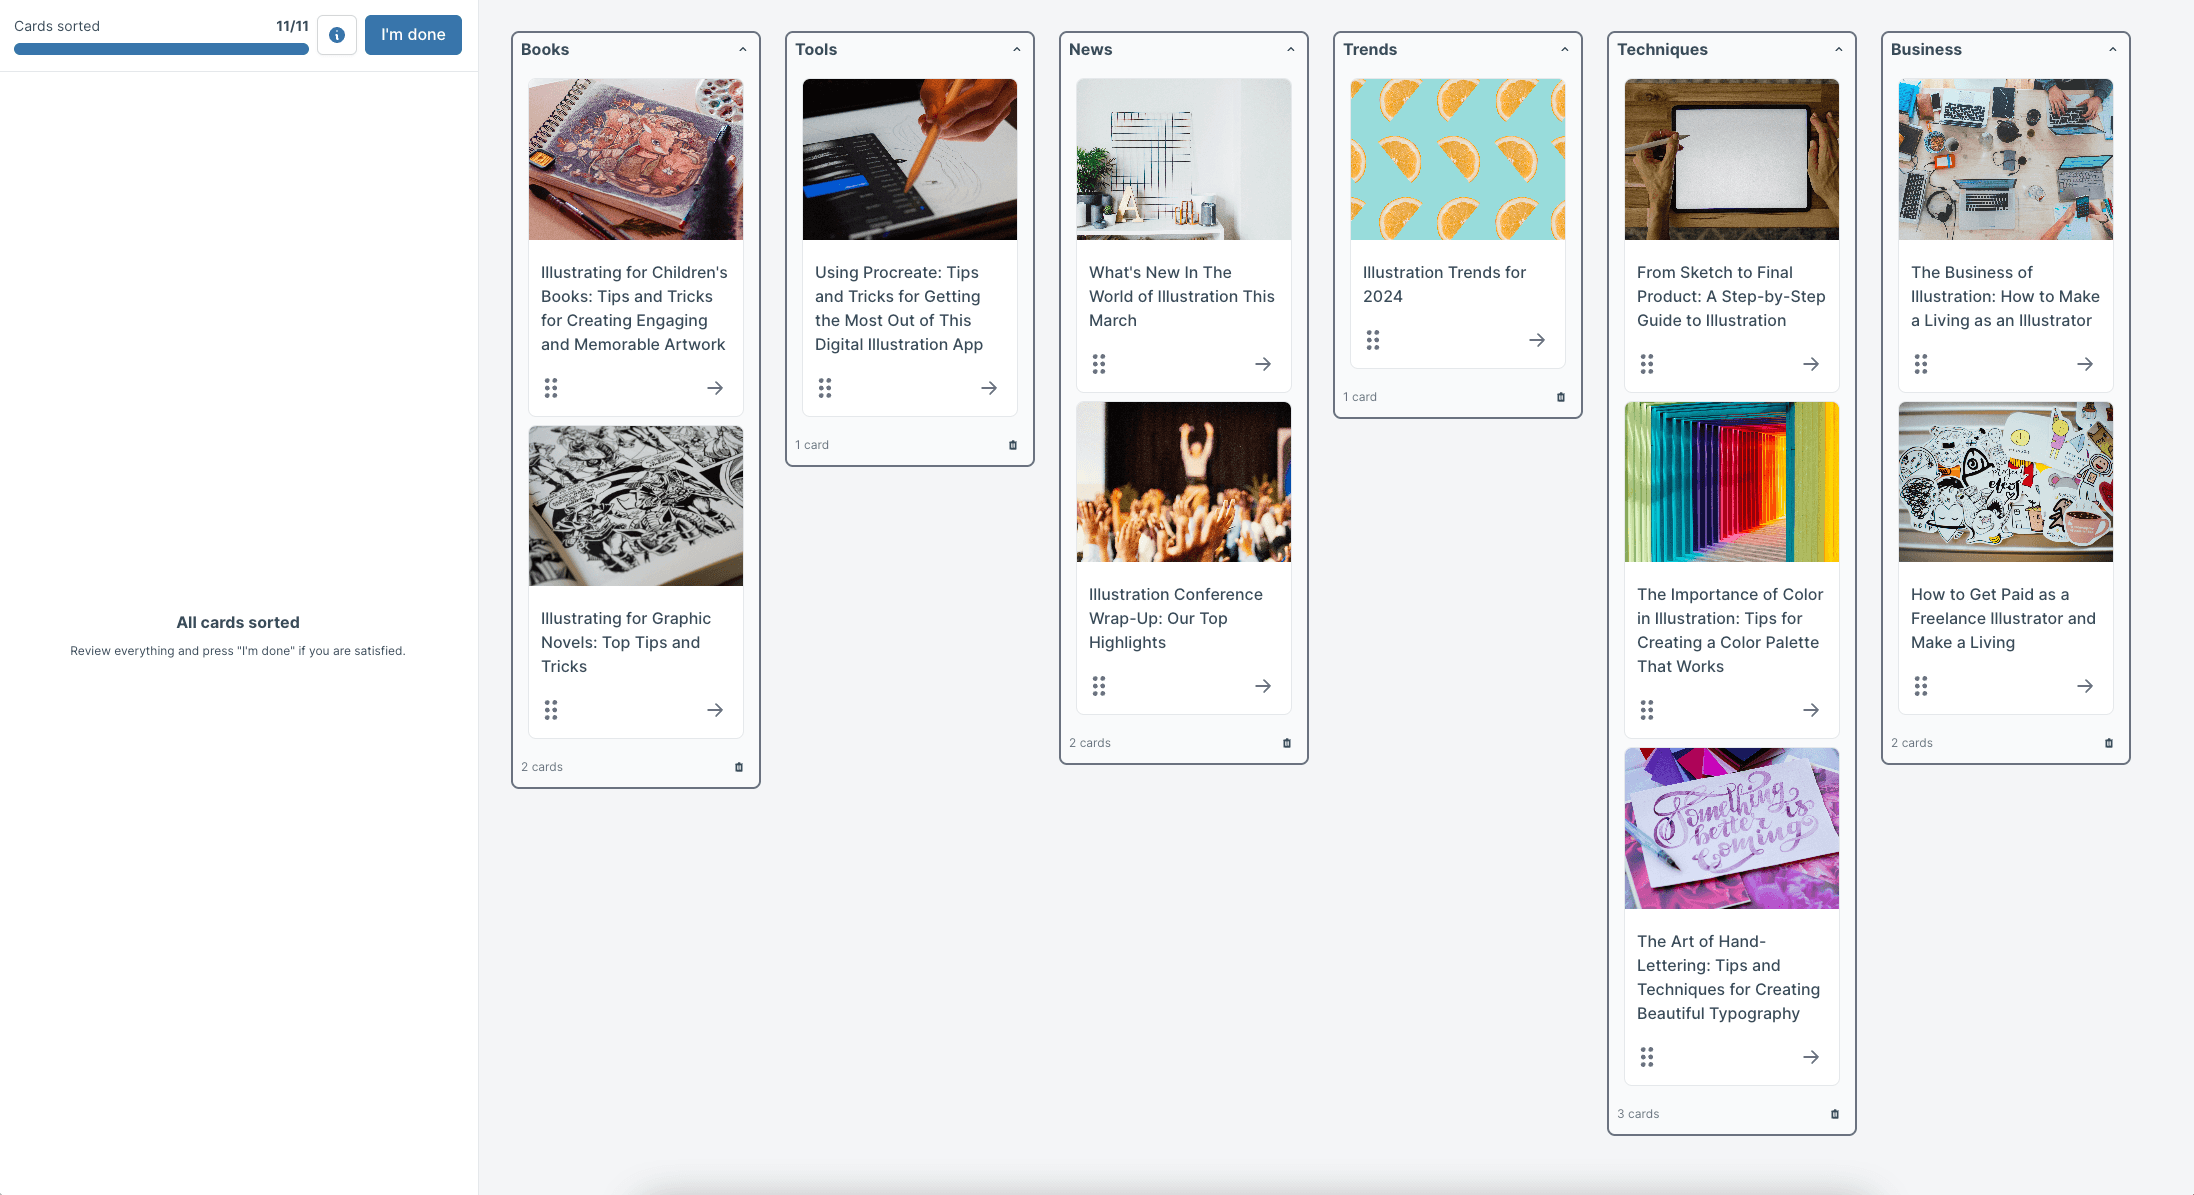
The results of an open card sort in Lyssna
Card sorting best practices
Following established best practices helps ensure your card sorting studies generate reliable, actionable insights that inform better design decisions.
Keep cards clear and concise
Avoid jargon and overly complex labels that might confuse participants or bias their sorting decisions. Clear, understandable cards lead to more reliable results.
Guidelines for clear cards:
Use plain language: Write in terms your users understand, not internal terminology.
Avoid ambiguity: Each card should have one clear meaning.
Test comprehension: Review cards with colleagues to identify potential confusion.
Consider context: Provide enough information for participants to understand each card's meaning.
Maintain consistency: Use similar language patterns across all cards.
Limit the number of cards
Research shows that 30 to 40 cards work best for engagement and meaningful results. Too few cards (under 30) don't provide enough data for patterns, while too many cards (over 40) overwhelm participants and reduce data quality.
Card quantity | Recommendation | Why |
|---|---|---|
Under 30 cards | Too few | Not enough data to identify meaningful patterns |
30 to 40 cards | Optimal range (sweet spot) | Balances insight depth with participant engagement |
40 to 50 cards | Use with caution | Engagement may start to decline; monitor for participant fatigue |
50+ cards | Avoid | Causes cognitive overload and reduces data quality |
Pro tip: If you have more content, run multiple smaller studies focused on specific areas rather than one overwhelming study.
Recruit the right users
Match test participants to your actual user personas to ensure insights reflect real user behavior rather than random preferences.
Recruitment criteria:
User experience: Participants should have relevant experience with your type of product.
Demographics: Match key characteristics of your actual user base.
Motivation level: Choose participants who are genuinely interested in helping improve the product.
Availability: Ensure participants can complete the task within your timeline.
Run a pilot test
Test your card sort with a small group first to ensure clarity and fix potential confusion before launching to your full participant group.
Pilot testing steps:
Internal review: Have team members complete the sort to identify obvious issues.
Small external test: Run with 3-5 external participants to catch real-world problems.
Instruction clarity: Verify that participants understand what they're supposed to do.
Technical functionality: Ensure the tool works properly across different devices and browsers.
Time estimation: Confirm that the task takes a reasonable amount of time to complete.
Combine with other methods
Use card sorting alongside other research methods for stronger information architecture validation. Card sorting shows how users want to organize information, while other methods test whether they can actually find what they need.
Complementary research methods
Research method | What it reveals | Use it to |
|---|---|---|
Tree testing | Whether users can find information in your proposed structure | Validate navigation effectiveness |
First-click testing | Where users first click when looking for specific content | Test intuitive placement of items |
Usability testing | The complete user experience of navigating your information architecture | Evaluate overall findability and user satisfaction |
Surveys | Additional context about user preferences and priorities | Understand the "why" behind user needs |
4 card sorting examples
These practical examples demonstrate how card sorting applies across different industries and use cases, showing the versatility and value of this research method.

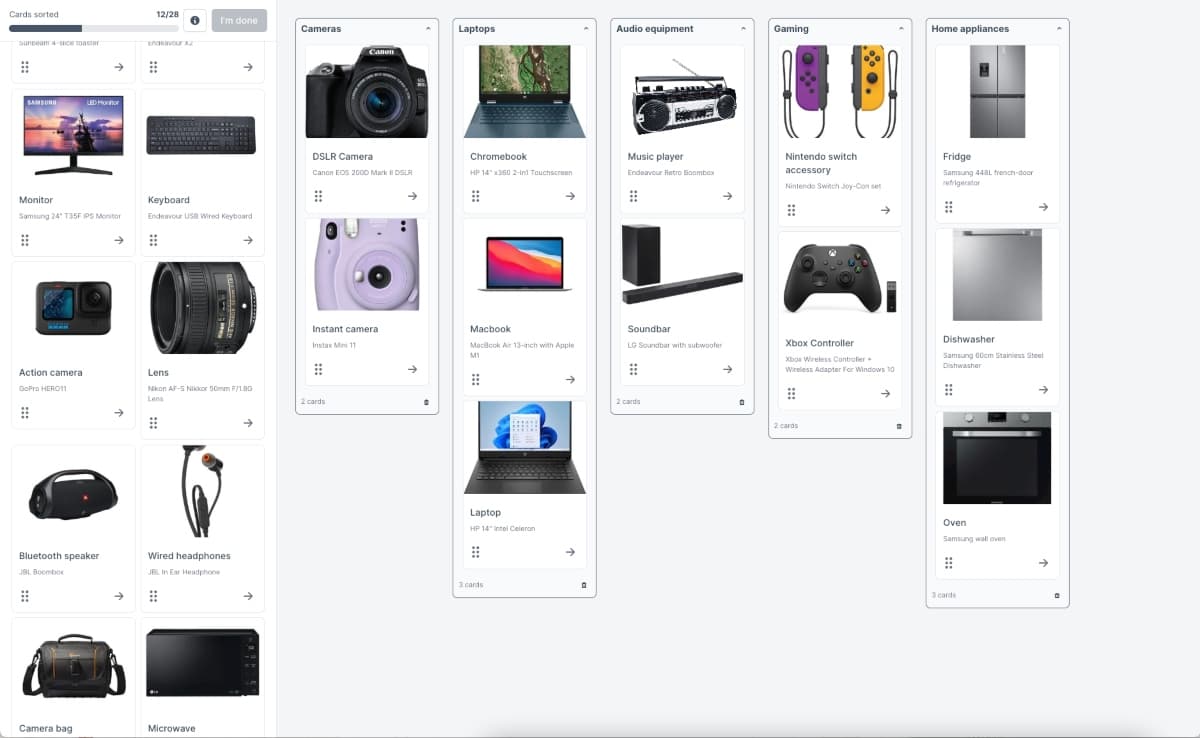
1. Ecommerce store
Grouping product categories helps online retailers create intuitive navigation that matches customer shopping patterns. For example, an electronics retailer might discover that customers group items by use case rather than technical specifications.
Common ecommerce card sorting applications:
Product categorization: Understanding how customers naturally group products.
Filter organization: Determining which filtering options are most important.
Menu structure: Creating top-level navigation that matches shopping behavior.
Search categories: Organizing search results in meaningful ways.
Example insight: Customers might group "laptop bags," "laptop stands," and "wireless mice" together as "laptop accessories" rather than separating them into "bags," "furniture," and "peripherals."
3. SaaS dashboard
Organizing features into intuitive menus helps software companies create interfaces that match user mental models of functionality and workflow.
SaaS card sorting applications:
Feature organization: Grouping related functionality for easier discovery.
Menu design: Creating navigation that supports user workflows.
Settings organization: Structuring configuration options logically.
Help content: Organizing support materials by user needs.
Example insight: Users might group "user management," "permissions," and "security settings" together as "team administration" rather than spreading them across different menu sections.
3. News website
Testing article sections helps media organizations structure content in ways that match reader interests and browsing patterns.
News website applications:
Content categorization: Organizing articles into meaningful sections.
Topic organization: Grouping related subjects for better discoverability.
Archive structure: Creating logical ways to browse historical content.
Personalization options: Understanding how users want to customize their experience.
Example insight: Readers might prefer "local news" as a primary category that includes politics, sports, and business from their area, rather than separating local content across topic-based sections.
4. Mobile banking app
Sorting transactions, accounts, and services helps financial institutions create mobile experiences that align with customer mental models of banking.
Banking app applications:
Service organization: Grouping banking services by customer needs.
Transaction categorization: Creating meaningful ways to organize financial activity.
Account management: Structuring account-related features logically.
Help and support: Organizing assistance options by common problems.
Example insight: Customers might group "transfer money," "pay bills," and "send money to friends" together as "payments" rather than treating them as separate banking functions.
Getting started
Lyssna has a library of card sorting templates to help you get started. Each template includes a link to example test results, showing you what successful card sorting studies look like in practice.
"Previously, a lot of UX tools would only let you run one study type at a time - Lyssna changed the game here. Being able to run a card sort and a tree test or first click task within a single study for example helps to get to navigation insights much quicker at a lower cost than trying to do all of these separately."
– Verified User in Hospitality, G2 review
How to analyze card sorting data
Card sorting analysis reveals patterns in how users organize information. Your goal is to identify common groupings, understand disagreements, and translate findings into practical navigation structures.
Look for grouping patterns
Examine which cards consistently appear together across multiple participants' sorts. These patterns reveal the strongest associations in user mental models.
What the patterns mean:
Agreement level | What it means | Action to take |
|---|---|---|
80%+ agreement | Strong association: Users clearly see these items as related | Group these cards together in your navigation |
60-80% agreement | Moderate association: Most users see a connection | Consider grouping, but validate with additional research |
Under 60% agreement | Weak or unclear association: No consensus | Clarify labels or accept that the relationship is ambiguous |
Pattern analysis techniques:
Frequency analysis: Count how often specific cards appear together.
Cluster identification: Look for groups of cards that consistently co-occur.
Outlier identification: Note cards that participants sorted inconsistently.
Use similarity matrices and dendrograms
Statistical tools quantify how often pairs of cards appear together, regardless of category names participants used.
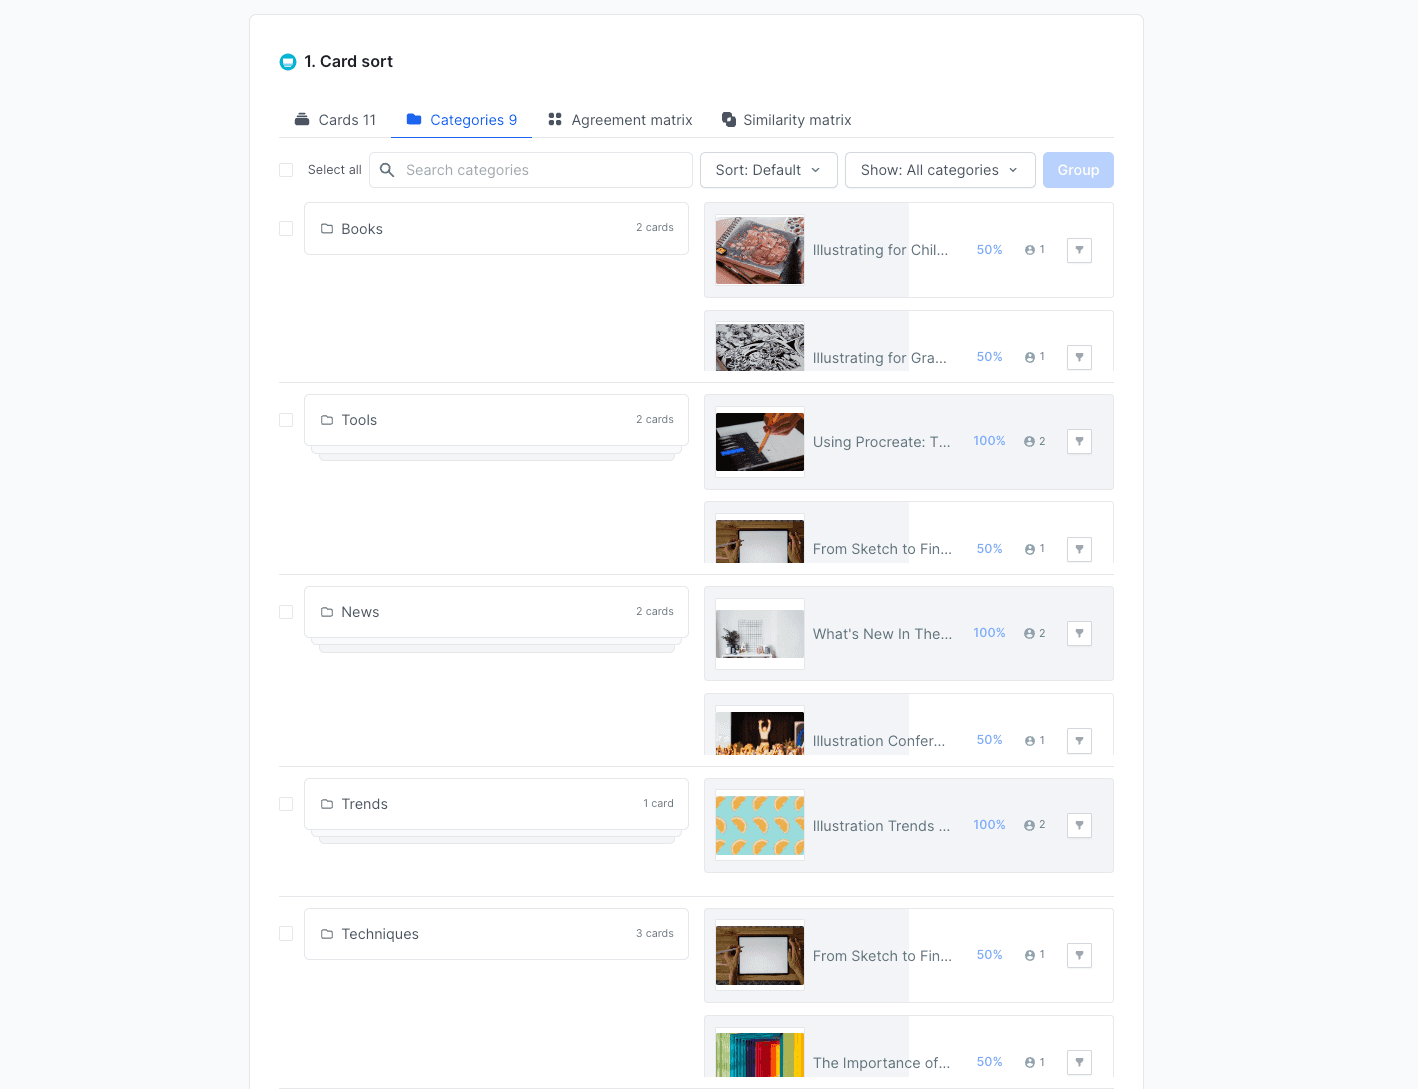
In Lyssna:
Agreement matrix shows the percentage of participants that placed each card into a category.
Similarity matrix (open card sorts) shows how often pairs of cards are sorted into the same category.
Tool | What it shows | Use it to |
|---|---|---|
Similarity matrix | How often card pairs appear together | Identify which items users associate most strongly |
Dendrogram | Hierarchical relationships between cards | Visualize natural groupings and determine optimal number of categories |
Understanding the scores:
High scores – Cards participants consistently group together.
Low scores – Cards participants rarely place in the same category.
Moderate scores – Cards with some association but not universal agreement.
Identify disagreements
Cards that users sorted inconsistently often indicate problems with labels, unclear concepts, or genuine differences in how users think.
Type of disagreement | What causes it | How to address it |
|---|---|---|
Label confusion | Unclear or ambiguous card names | Revise confusing card names based on user feedback |
Concept overlap | Items that logically fit in multiple categories | Accept complexity — some concepts genuinely belong in multiple places |
User diversity | Different user groups with different mental models | Consider different organizational schemes for different user types |
Missing context | Cards need more information | Add descriptions or examples to ambiguous cards |
Translate into IA recommendations
Turn findings into actionable navigation structures by using card sorting insights to inform your information architecture decisions. Here’s how the process might look like:
Identify high-level patterns: Look for the strongest groupings across participants.
Standardize categories: Combine similar category names that participants created.
Use built-in reporting tools: Leverage platform analytics to quantify relationships.
Define categories: Create proposed navigation structures based on patterns.
Balance with business needs: Consider technical and business constraints alongside user preferences.
Validate with testing: Plan follow-up research to test your proposed information architecture.
Implementation considerations:
Business constraints: Balance user preferences with technical limitations.
Content strategy: Ensure your IA supports content goals and user needs.
Navigation design: Create menu structures that reflect user mental models.
For detailed guidance on analyzing your results, refer to this Lyssna help center article that explains how to view and analyze your card sorting test results in Lyssna.
Ready to understand your users' mental models?
Build intuitive navigation with Lyssna's card sorting tool. Sign up for free and start organizing content the way your users think.